| |
The
effect of Pittosporum undulatum on the native vegetation of the
Blue Mountains of Jamaica
|
| |
May 1997
|
| |
T. Goodland and J.R.
Healey, School of Agricultural and Forest Sciences, University of Wales,
Bangor, LL57 2UW, U.K.
Contact email j.healey@bangor.ac.uk
|
| |
1.1
Background
|
| |
The Australian
tree Pittosporum undulatum Vent. was introduced to the Blue Mountains
of Jamaica in 1883. Sixty-six years later this bird-dispersed tree had
become "perhaps the commonest tree" in secondary forest around the Cinchona
Botanic Gardens, its place of introduction (Bengry & Serrant 1949).
Previous research projects have identified its competitive success against
native tree species (Healey 1990) and the low density and species richness
of native vegetation beneath dense stands of the alien (Goodland 1990).
The density of P. undulatum seedlings in areas of previously uninvaded
forest greatly increased following the disturbance created by Hurricane
Gilbert in 1988 (Bellingham 1993), and the species has now spread throughout
at least 1,300 ha of primary and secondary montane forest (Healey &
Goodland 1995). We have estimated that the area of the potential range
of the species in the Blue Mountains could be as high as 44,000 hectares
(Goodland & Healey 1996), seriously threatening the high biodiversity
of the mountain range. There are about 275 species of flowering plants
in the Blue and John Crow Mountains National Park endemic to Jamaica (Grubb
& Tanner 1976, Bellingham 1993, Muchoney et al. 1994).
|
| |
These
facts have led to concern amongst many scientists that the spread of P.
undulatum in the Blue Mountains may lead to the competitive exclusion
of many native plant species. The former Park Manager considered the need
for reliable information about the impact of the invasion to be one of
the highest priorities for the national park (D. Lee, pers. comm., 1991).
This is because past work had not provided sufficient evidence of the severity
of the threat to convince donor agencies of the need to provide necessary
funds for a control programme, or to form the basis for a management plan
when funding is available. |
| |
This report,
therefore, investigates the effects of P. undulatum on the native
plant biodiversity of forests of the Blue Mountains. Given sufficient time
(and without man's intervention) it seems probable that all the montane
forests of the Blue Mountains would become invaded by P. undulatum.
The lower altitudinal limit of P. undulatum is poorly known (it
is probably between 600-1000 m), but most primary, and therefore diverse,
forest below 1000 m has been cleared in the last two centuries or so. The
report deals only briefly with "time-dependent" issues, (such as the current
extent of P. undulatum, the rate of spread, population changes in
permanent sample plots, possible limiting factors to its range), or the
ability of P. undulatum to grow outside the forest (on deforested
slopes or landslides), subjects dealt with in Goodland & Healey (1996).
It concentrates on the immediate and long-term effects of the introduced
species once it has already arrived at a site, a small area of forest such
as a permanent sample plot.
Possible effects on other
aspects of the ecology of the Blue Mountains (non-vascular plants, animals,
the nutrient and hydrological cycles), and on humans, were considered in
Goodland & Healey (1996).
|
| |
The
factors that determine the effect of P. undulatum on native plants
in the Blue Mountains can be broken down into the rate of dispersal, the
ability of the species to capture land and resources once it arrives at
a site (its competitve ability) and its persistence (whether it is eventually
replaced by other species at the site). |
| |
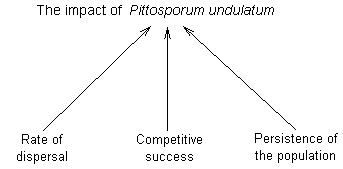
Figure
1. Factors that determine the success and impact of an invasive plant
such as P.
undulatum |
| |
The main factors
that control the rate of dispersal of P. undulatum are shown in
the figure below. In summary:
-
P. undulatum was introduced
to the Cinchona Botanic Gardens in 1883
-
the species may have been planted
by man outside the gardens
-
in the few decades after introduction
most of the land around Cinchona which had been under coffee and Cinchona
plantations was gradually abandoned and reverted to secondary forest
-
P. undulatum juveniles
start to produce seed when about 5-6 years old
-
seed production is high, a regression
relationship between DBH and seed production in 1992 giving a mean of 37,500
seeds for a 8 cm DBH tree
-
seed production has been at least
fairly high for every year from 1992 to 1996
-
there are at least six common
native bird species that eat and presumably disperse P. undulatum
seeds
-
vegetative spread, through mechanisms
such as suckering or layering, are not important to the rate of invasion
-
the species is able to establish
itself in all habitat types in the western Blue Mountains, though with
difficulty in very undisturbed forest, in Mor Ridge forest or on landslides
-
Hurricane Gilbert in particular
and probably hurricanes in general have played a major role in facilitating
the establishment of the species in otherwise undisturbed forest
|
| |
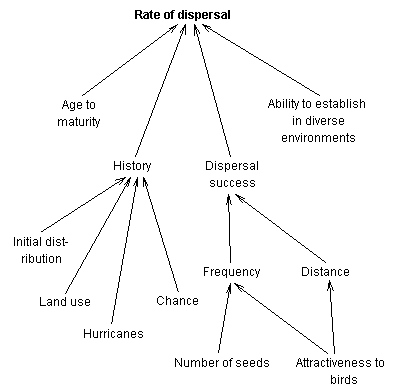 Figure
2. Factors determining the rate of spread of P.
undulatum in the Blue Mountains Figure
2. Factors determining the rate of spread of P.
undulatum in the Blue Mountains |
| |
This
report will focus on the competitive suppression by P. undulatum
of native plant species, as the competition for light and below-ground
resources are the most obvious mechanisms by which P. undulatum
may affect native species. P. undulatum trees have a dense crown,
so shade probably accounts for a large part of the suppressive effect of
the species (though we cannot determine to what extent the dense canopy
has its effect because of a reduction in light or a probable reduction
in throughfall). We have some evidence that the below-ground competitive
ability of P. undulatum is high in comparison with the native species,
though we have no experimental evidence on the relative importance of above-
and below-ground competition. We give our best assessment of the persistence
of P. undulatum in the Discussion chapter at the end. |
| |
There are several
other possible mechanisms by which P. undulatum may affect native
plant species, briefly discussed below, though little is known about many
of these.
-
Allelopathy. Allelopathy
has been suggested as a factor depressing the number of native seedlings
beneath scattered P. undulatum trees in the Blue Mountains where
the light levels would have indicated a higher seedling density (J. Dalling,
pers. comm., 1991). In Australia, Gleadow and Ashton (1981) found that
leachates from P. undulatum leaves appeared to inhibit the germination
(expressed as a percentage of control) of several Eucalyptus species;
for example, germination of E. obliqua, E. melliodora and E.
gonocalyx was 47.1, 8.1 and 48.3% of untreated seeds. However, they
stated that no inhibitory effects, other than that expected from deep shade,
have been shown under canopies in the field. In South Africa, Richardson
& Brink (1985) found no seedlings of P. undulatum or native
species beneath established P. undulatum trees and thought that
this was due to an allelopathic effect from P. undulatum foliage.
-
P.
undulatum trees as a habitat.
The greatest effect that P. undulatum may have as a different habitat
to native trees is on animals, but the structure of its crown or nature
of its bark may have an effect on epiphytic plants, independent from the
density of its foliage. A large proportion of the non-woody plant species
in the Blue Mountains are epiphytic (P.J. Bellingham, pers. comm., 1994),
but the effect of P. undulatum on epiphytes was not specifically
addressed in the study, mainly because of the great difficulty of seeing
through dense canopies of P. undulatum trees. Our observations and
data collected by Mitchell (1989) suggest that the numbers of epiphytes
are much reduced both in the crowns of P. undulatum trees in comparison
with native trees of similar size and on native species beneath dense P.
undulatum canopies. This could be due to many factors such as reduced
light levels and rain throughfall, the upright growth habit, different
branch arrangement and bark characteristics of P. undulatum trees,
allelopathic leachates from P. undulatum foliage and the faster
growth rate of P. undulatum trees (hence less time for establishment).
-
Effects
on animals. The most obvious example of the effect of P. undulatum
on a native plant caused indirectly by the effect on an animal is the effect
the alien may have on pollinators and seed dispersers of native plants.
If P. undulatum is relatively successful in attracting pollinators
and dispersers, and if those tree species that are less attractive are
neglected as a consequence, these native species could find their regeneration
threatened. These indirect effects could be very important, but they are
hard to determine. Conversely, as native trees become isolated in heavily
invaded forest, their predation by native, co-evolved pests and pathogens
is likely to decline as they become harder to find.
-
Effects on susceptibility
of native species to windthrow. Another possible mechanism by which
P.
undulatum could affect native trees is by changing their allometry
through greater competition, thus changing their vulnerability to windthrow.
Studies of the impact of Hurricane Gilbert show that hurricanes play a
major role in the forest dynamics of the Blue Mountains. Also, P. undulatum
trees do not get covered with lianes as frequently as native species (though
this could be because most climber species seem to be restricted to primary
and therefore less invaded forest), so would not pull down other trees
when blown down, (though we have no evidence as to the importance of this
phenomenon in the Blue Mountains).
-
Change in disturbance regime.
As it is likely that P. undulatum trees are blown over at a smaller
size than the average for native species (Healey & Goodland 1995),
the advanced stage of invasion would see, after hurricanes, a high proportion
of the area in gaps. Because of the sparse understorey beneath dense P.
undulatum (few P. undulatum seedlings as well as few native
seedlings) a few highly gap demanding native species, such as Bocconia
frutescens and Brunellia comocladiifolia, (as well as alien
weeds like P. undulatum and Polygonum chinense) may benefit.
|
| |
|
| |
|
1.2 Report
structure
The report has
two main chapters. The first examines the direct evidence for the effects
of P. undulatum. The only way to do this is examine differences
in the performance of native species with varying amounts of P. undulatum.
We have tried three approaches:
-
Correlation between
the dominance of P. undulatum and native vegetation in many plots
at one point in time.
-
Correlation between
the change in dominance of P. undulatum and native vegetation through
time, in a smaller number of plots.
-
Experimental removal
of P. undulatum.
We have not tried
the fourth possibility, the experimental addition of P. undulatum,
because of time, and ethical, constraints.
The second chapter
considers the reasons for any competitive effects, though our understanding
of causal mechanisms are not well advanced, and are partly conjecture.
The project has not had the explicit objective of discovering the causes
for any effects P. undulatum may be having. Despite this, data and
observations collected from the Blue Mountains, together with information
from other invasions, have been enough to provide strong indications on
the underlying mechanisms.
We examine likely
reasons for the competitive success and hence supression by P. undulatum
of native species in three categories, in each case comparing P. undulatum
with native species. These three categories are not true causes, in the
sense that they themselves are the result of more underlying physiological
or ecological mechanisms. We have discovered many facts about the biology
of P. undulatum necessary to an understanding of its success without
(mainly through time constraints) being able to find out similar information
for native species - aspects such as age to reproductive maturity, seed
production per individual. Full information on P. undulatum is given
in Goodland & Healey (1996). In this report we focus on those important
aspects of the invasion for which we have information on native species
as well as P. undulatum. This list of questions and subsequent analyses
are not intended to be comprehensive, but only to address the more important
factors.
-
Growth rate
of individuals. How fast do P. undulatum individuals grow?
-
Growth form
of individuals. What is the growth form of P. undulatum individuals?
How large do P. undulatum trees get?
-
Population density.
What is the survival rate of P. undulatum juveniles? How dense can
P.
undulatum populations become?
The results from
the two main chapters are discussed in the last chapter.
A full list
of all woody species occurring in the Blue Mountains permanent sample plots,
together with the 6-letter codes used in some figures, is given in an appendix.
2. Direct
evidence for the effect of Pittosporum undulatum
The most important
direct evidence for the effects of P. undulatum on native plants
come from two removal experiments established in forest near Cinchona (the
place of introduction). More data and analyses are presently available
from the first of these, Heavily Invaded Forest Experiment - its methods
are described in detail in Healey et al. (1992), only briefly here.
The second removal experiment, the Slightly Invaded Forest Experiment,
is described fully, although the experiment is still at an early stage.
2.1
Methods
2.1.1
Heavily Invaded Forest Experiment
Pittosporum undulatum usually
occurs on steep hillsides with thin and rocky soils and is typically associated
with a sparse and depauperate understorey. To understand the effect P.
undulatum is having on the native vegetation it is necessary to experimentally
remove it. It is not sufficient to rely on simple correlations between
P.
undulatum dominance and the native vegetation alone, as P. undulatum
might be largely restricted to unstable and often human disturbed forests,
which may naturally have an understorey of low diversity. A removal experiment
was established in forests with a range of degrees of invasion in the western
end of the Blue Mountains during the latter half of 1991.
Specific
questions
The questions concerned with
the effect of P. undulatum that HIFE was designed to answer are:
-
How close is the apparent correlation
between P. undulatum dominance and the recruitment, survival and
growth of native vegetation?
-
Will there be a decline in the
dominance of native species between the first and subsequent enumerations
in the Undisturbed control treatment?
-
After P. undulatum removal,
to what extent will the diversity and density of native species in the
understorey increase?
-
What is the relative effect of
P.
undulatum trees and P. undulatum seedlings on native vegetation?
Methods
A randomised block design
was used, with five blocks, five plots within each block and four treatments.
Each block contained two replicates of the undisturbed control and one
of the other three treatments. The design was partially orthogonal. Each
plot was 1212 metres, surrounded by a 9 m guard area (giving a 3030 m treatment
area). Twenty 11 m sub-plots were randomly selected within each plot. Woody
plants over 3 m tall were enumerated within the 1212 m plot, those less
than 3m, in the twenty 1 m2 sub-plots. Each individual was identified
to species level wherever possible and labelled with an aluminium identification
tag. There were four treatments:
-
Undisturbed Control (UC).
No treatment.
-
Remove P. undulatum Trees
(RPT). P. undulatum trees (plants >3m) were cut, the stumps
were not treated with a herbicide, but the resprouts were removed three
times after cutting in an attempt to kill them.
-
Remove all P. undulatum (RAP).
All P. undulatum seedlings over 50 cm tall were killed (pulled up
whenever possible) in the 3030 m treatment area and all other P. undulatum
seedlings were killed within the central 1414 m area (ie. at least 2 m
from the nearest sub-plots). All P. undulatum recruits in all the
sub-plots have been removed on three occasions since the original treatment.
-
Remove Equivalent Native Trees
(RENT). In this treatment native trees were removed until the same
total GBH was removed as that of P. undulatum in the RPT treatment
in that block.
Table 1. Enumeration
activity, size class, treatment dates and months from the pre-treatment
enumeration, in the Heavily Invaded Forest Experiment.
Activity Size class Date
Months
Pre-treatment enumeration
(t0) Trees and seedlings July-August 1991 0
Imposition of treatments Sept.-Oct.
1991 2
First post-treatment enumeration
(t1) Seedlings August 1992 12
Second post-treatment enumeration
(t2) Trees and seedlings December 1993 28
Partial enumeration Dead seedlings
only June 1995 46
Full enumeration of trees
Trees July 1996 59
2.1.2
Slightly Invaded Forest Experiment
The Heavily Invaded Forest Experiment
is providing valuable information on the effects of P. undulatum
on native vegetation. However, HIFE has a major limitation in its ability
to provide proof of the effects of P. undulatum in that, by necessity,
it was carried out in highly disturbed secondary forest in which P.
undulatum is abundant, (P. undulatum probably regenerates after
near total clearance, cultivation and then abandonment) - the prime objective
of the experiment had been to provide information on the management of
P.
undulatum in heavily invaded forest. Another characteristic of this
secondary forest on the southern slopes of the mountain range is that it
has a lower species diversity than primary and old secondary forest (T.
Goodland, unpublished data). Therefore the capacity of native species to
respond to the removal of P. undulatum is, as expected, limited.
The primary factor is likely to be a lack of propagules, as there are no
nearby potential seed parent trees of many species that would be expected
to occur in primary forest on such sites. In addition, there may be characteristics
of the soil in such secondary forest that limit the capacity of native
species to colonize (Dalling (1992) studied the extreme case of landslides
where all top soil had been lost from much of their surface). However,
we have no evidence that the soil conditions in the HIFE plots do limit
the establishment of native species that would occur in primary forest
in these sites.
The only way to objectively
determine the effect that P. undulatum has is to follow the whole
invasion process in permanent plots, paired with plots in comparable forest
from which P. undulatum is removed as a seedling or small tree.
Therefore during June to September 1994 we established a second removal
experiment. The experiment had the specific objective of investigating
the effect of P. undulatum on native plants and so was set up in
diverse primary forest only slightly invaded by P. undulatum. It
is called the Slightly Invaded Forest Experiment (SIFE).
Objectives
The long-term objectives of
SIFE are to investigate the following:
Population dynamics of
the invasion
-
Performance (recruitment, growth
and survival) of P. undulatum and native species in gaps and understorey
-
Relationship between P. undulatum
seedling performance and distance to the nearest mature P. undulatum
tree (for which an assessment of the fecundity, and position relative to
the plot, of all P. undulatum trees in the treatment area or vicinity
will be made)
-
Micro-site distribution of P.
undulatum and common native seedlings; to what extent is the distribution
clumped, because of bird dispersal patterns or preferential establishment
on certain substrates?
Effect of P. undulatum on
the native community
-
Performance of native tree seedlings,
either by plot level correlations or by proximity to individual P. undulatum
saplings and trees
-
Growth form (eg. degree of branchiness,
leaf area) of those native species able to grow in both treatments
-
Distribution of herbs, climbers,
epiphytes, and non-vascular plants
Effect of P. undulatum on
community level productivity
-
Community productivity, in terms
of basal area increment, biomass increment (perhaps by means of limited
destructive harvesting in the treatment area or surrounding forest), and
litterfall (quantity and quality)
-
Soil chemistry and nutrient status
-
Effect of P. undulatum
on forest microclimate and hydrology, e.g. throughfall, stemflow, soil
moisture
-
Light regimes, as characterised
by hemispherical photographs, and/or PAR quantum sensors
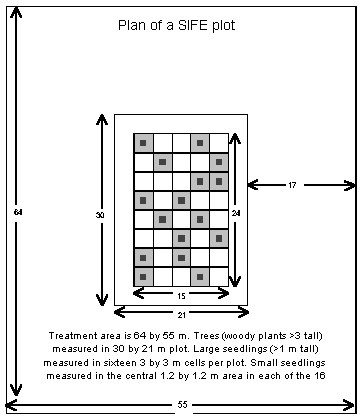
Figure 3. Plan of
a Slightly Invaded Forest Experiment plot
Differences between SIFE
and HIFE
The similarities between the
two experiments include, of course, the central interest in the effect
that P. undulatum has on the forest, the identical height/girth
thresholds used to define the different categories of plants, and the presence
in SIFE of all the species present in HIFE. The most notable differences
are:
-
The forest in SIFE is generally
much less invaded by P. undulatum, with only very occasional trees
and a seedling density of around 0.1 to 0.5 m-2. It seems unlikely
that native plants in forest so little dominated by P. undulatum
would have been appreciably affected yet. The forest in all SIFE plots
appears either not to have ever been disturbed by man or to be very old
secondary forest. All the forest in HIFE is certainly secondary (with the
possible exception of about a third of one block), often relatively young
(c. 40 rs old?) secondary forest.
-
The plots in SIFE are much larger.
This is to increase the chance that gaps will occur in each plot within
the projected life of SIFE. The buffer zone is 20 m (10 m in HIFE); this
is because we hope SIFE is going to be a longer term experiment than HIFE,
and P. undulatum trees can attain heights greater than 20 m.
-
The plots have been located on
less steep slopes than HIFE. This is to minimise disturbance during enumerations
and removals. Considerable time was spent on locating suitable sites, as
most of the Blue Mountains are very steep, and if not too steep, usually
sites were not suitable because of too little or too much P. undulatum;
too much disturbance, mostly from Hurricane Gilbert; or the sites had Mor
Ridge Forest which has a distinctively different species composition (Grubb
& Tanner 1976) so would not have been comparable with other sites.
Methods
The experiment has a simple
randomised block design, with six blocks and a single replicate of each
treatment in each block, randomly assigned. Each 2415 m plot is staked
out in 33 m cells, with eight 315 m strata. In the centre of two cells
in each strata a 1.21.2 m sub-plot has been established in which all tree
seedlings were enumerated; all seedlings over 100 cm tall and all saplings
(300 cm tall to 10 cm GBH) were enumerated in the remainder of the 33 m
cell.
Enumeration
Trees (defined as those
woody plants >3m tall). We identified and measured the GBH of all trees
within the 30 x 21m plot. All individuals were tagged with aluminium tags
(except plants >3m tall to 10 cm GBH within the 16 selected cells in each
plot, which had their coordinates within the cell measured instead). Thirty-five
individuals have not been identified yet, and a further 24 individuals
have only tentatively been identified to specific level. Another 240 individuals
belong to groups of closely related species either difficult to distinguish
without fertile material or of doubtful status as separate species.
Large seedlings (defined
as woody plants >1m tall). We identified and measured the height of all
woody plant seedlings >1m tall in the sixteen 33 m cells. The spatial coordinate
of each within the cell (to the nearest 5cm) was recorded.
Small seedlings (defined
as woody plants <1m tall) occuring in the 1.2x1.2 m sub-plots were similarly
measured, although the spatial coordinate of each was recorded to the nearest
centimetre. Where a particular species occurred at a high density, seedlings
were marked with aluminium tags.
There have been three enumerations
so far, all carried out in the month of July:
1994 The full pre-treatment
enumeration.
1995 We measured the
height of P. undulatum seedlings only; we removed P. undulatum
from half the plots as planned.
1996 We measured the
height of all seedlings in 12 sub-plots, 6 beneath P. undulatum
trees and 6 which had never been beneath P. undulatum trees. After
an initial analysis it was decided that a full re-enumeration would be
premature.
2.2 Results
2.2.1
Relationship at one time
The relationship between the
basal area of P. undulatum and the density of native seedlings at
the initial enumerations of the 37 HIFE and SIFE plots is shown in Figure
4.
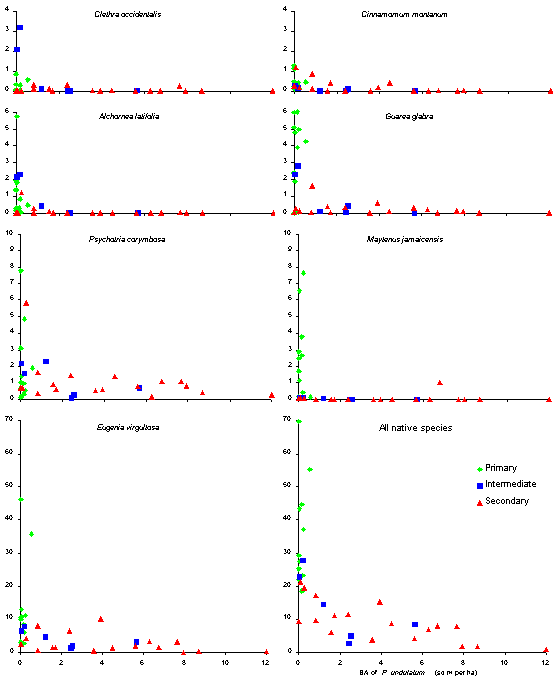
Figure 4. Relationship
between the basal area of P.
undulatum (m2 ha-1) and the mean seedling density
(m-2, on the y-axis) of seven important native species, and
all native species combined, in 37 plots (HIFE and SIFE). Each plot has
been put into one of three classes of past human disturbance. Note the
different scale in the bottom two graphs to the rest of the graphs.
There is a definite relationship
between the basal area of P. undulatum and the density of all native
seedlings combined. The relation is best described as linear if the very
high values in some of the primary forest plots are excluded - these values
are largely due to the shade-tolerant Eugenia virgultosa, (the species
occurs at a much higher density (in primary forest) that any other native
species in our permanent sample plots). The relationship indicates that
the density of native seedlings falls to near zero in the most heavily
invaded forest.
Two reasons for the fairly
large amount of scatter in the relationship is firstly due to spatial variation
in the density of P. undulatum trees in some plots, especially the
large SIFE plots. Another reason may be the use of basal area and the way
it increases so rapidly with DBH. For example, the basal area of the largest
P.
undulatum tree we have found is 3380 cm2, 478 times that
of a 3 cm DBH tree (the bottom of the tree size class). Given the usually
dense crown of smaller P. undulatum trees and the often thinning
crowns of larger trees it seems unlikely that there could be such a difference
in the effect of trees of these different sizes.
Guarea glabra and Cinnamomum
montanum are two shade-tolerant species common in primary forest, but
rare as trees in secondary forest. Both species show signs of re-invading
older secondary forest, however neither species appear to show an ability
to grow into larger size classes beneath dense P. undulatum. Maytenus
jamaicensis is a shade-tolerant species typically confined to primary
forest (with only one secondary or intermediate plot with the species present
in as a seedling) so making it very difficult to determine what effect
P.
undulatum has on the regeneration of the species. Eugenia virgultosa
is the only species (for which we have sufficient data) that has significant
numbers of seedlings reaching large seedling size in heavily invaded secondary
forest. Psychotria corymbosa is a species (rarely exceeding 6 m
in height) fairly common as a seedling in secondary as well as primary
forest. However mortality of small (<20 cm) seedlings is high and there
is very little recruitment of the species in heavily invaded forest. Alchornea
latifolia and Clethra occidentalis are gap demanding/benefitting
species rare in forest with more than about 1 m2 of P. undulatum
per hectare; adult trees of both species are common in secondary forest
so seed input is unlikely to be limiting.
2.2.2
Relationships through time
We have data on more than one
seedling enumeration in HIFE, so allowing an examination of the relationship
between the increase in dominance of P. undulatum (in every plot
the total basal area of P. undulatum has increased between every
enumeration - if P. undulatum trees are present at all) and change
in native understorey vegetation. Only data from the ten Undisturbed
Control plots in HIFE have been used for these through--time analyses.
Three enumerations have been made of trees and seedlings in HIFE, however,
the second and third tree enumerations did not coincide with the second
and third seedling enumerations (the mean dates are given below). Therefore,
the P. undulatum basal area at the time of the second seedling enumeration
(t1) was estimated from the growth of P. undulatum between
t0 and t3.
Table 2. Mean dates
of enumerations of seedlings and trees in the HIFE plots.
t0 t1
t2 t3
Seedlings 12/08/91 22/08/92
12/01/94
Trees 12/08/91 24/12/93 08/07/96
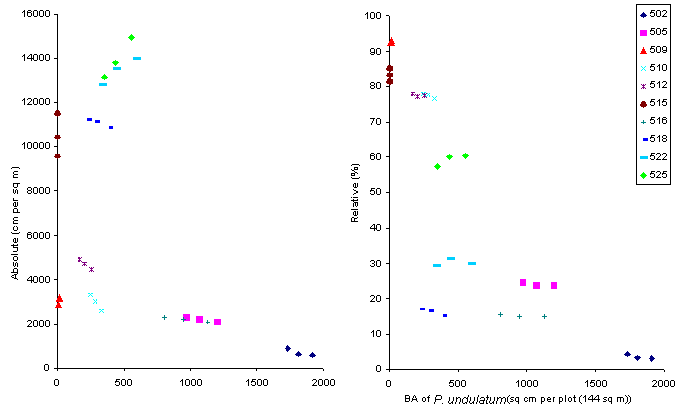
Figure 5. The relationship
between the basal area of P.
undulatum and dominance of seedlings of native trees at three enumerations
in the ten Undisturbed Control plots in HIFE., (a) absolute dominance values,
(b) relative dominance values. Note that in all plots (except plot 15 where
P.
undulatum was not present) the basal area of P. undulatum increased
between each enumeration
The relationship between the
basal area of P. undulatum and absolute dominance of native
seedlings at the three enumerations (Figure 5(a)) is not clear. Four plots
experienced an increase in the dominance of the seedling layer in absolute
terms, all plots where P. undulatum had not achieved great dominance,
with the disturbance caused by Hurricane Gilbert in 1988 probably still
having an effect.
The relative dominance
of native seedlings shows a clearer relation with the dominance of P.
undulatum. There is a general tendency for there to be a diminishing
dominance of native seedlings with more P. undulatum. One notable
aspect of this relationship is the presence of a clear boundary to the
maximum dominance (or density or diversity) of native vegetation. This
suggests that, though many factors (such as disturbance history, soil type
and depth, and slope steepness) influence native vegetation, P. undulatum
appears to be a clear limiting factor. It is not possible to say whether
the species acts directly (by allelopathy for example) or indirectly (by
depriving understorey plants of resources). Time does not appear to equate
with space; if it did, one might expect the mean slope of the relationship
for each plot through time to be about the same as that of the slope between
plots at one point in time. Eight of the ten plots showed a decline in
the relative dominance between t0 and t2 but the situation was complex
- five plots showed a decline in both intervals, three plots showed a decline
then increase, one plot showed an increase then decline and one an increase
in both intervals.
Analyses of the effect of
differing amounts of P. undulatum on the growth and survival of
native species did not give clear results. There was a tendency for the
growth rate and survivorship of Eugenia virgultosa and all native
species combined to decrease with increasing P. undulatum, but there
was much variation between plots. The problems of carrying out this investigation
in forest with so few native seedlings was apparent.
In July 1996 we carried out
a preliminary enumeration of SIFE, exactly one year after the removal of
P.
undulatum. It did not seem likely that there would be a major effect,
as P. undulatum had not been dominant in any of the plots. The cover
of native trees was sufficient to prevent a very marked increase in light
levels following P. undulatum removal. The table below shows the
results from the enumeration. These results have been shown only to give
an indication of the situation in 1996, they are not full statistically
valid, because the data was collected from only two plots.
Table 3. Number
of seedlings, mean absolute height increment (cm) and standard error of
the mean (SEM), of Eugenia
virgultosa, other native species and P. undulatum in SIFE. Results
are shown from six sub-plots (in plot 1) beneath the crowns of at least
one P. undulatum tree, and six sub-plots (in plot 2) that have never
experienced shading from P. undulatum.
Beneath P. undulatum
Not beneath P. undulatum
No. MAI SEM No. MAI SEM
Eugenia virgultosa
72 2.27 0.27 68 2.56 0.39
Other native species 48 4.63
0.67 51 4.75 0.72
P. undulatum 38 6.47
1.05 44 7.38 1.13
The growth rate was not significantly
different (at the 5% level) for any of the three species groups between
the two treatments, though was significantly different for the three species
groups.
2.2.3
Removal of P. undulatum
The density of P. undulatum
and native species recruits is shown in Figure 6 with numbers of recruits
for the two (post-treatment) enumerations combined.
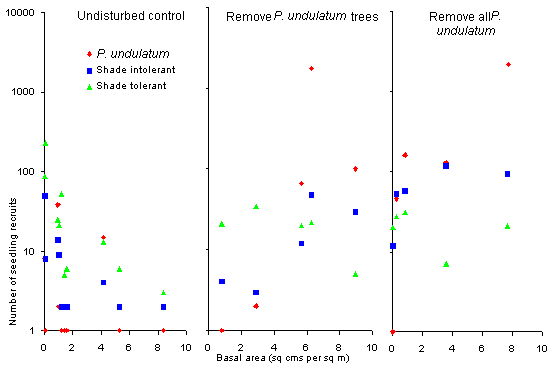
Figure 6. Variation
in the numbers of seedling recruits (log scale) between 1991 and 1993 of
three species groups (P.
undulatum, Shade-intolerant native species and Shade-tolerant native
species) per plot, with basal area (cm2 m-2) of P.
undulatum. The results of three treatments are shown, each being the sum
of the number of recruits at the two post-treatment enumerations. For the
Undisturbed
Control treatment (10 plots) the recruitment is plotted against the
basal area of P. undulatum in 1991. For the Remove P. undulatum
Trees and Remove all P. undulatum treatments (5 plots each) the
recruitment is plotted against the basal area of P. undulatum removed
in 1991.
Overall, the graph on the
left (Undisturbed Control) shows that the number of recruits declined
with increasing amounts of P. undulatum, whilst the two other graphs
show that the number of recruits increased with increasing amounts of P.
undulatum removed in 1991. Results are shown separately for the six
commonest shade-tolerant species and the six commonest shade-intolerant
species, commonest meaning as new recruits at the t1 enumeration.
The recruitment of shade-tolerant species was higher in the Undisturbed
Control treatment though declined at about the same rate as the recruitment
of shade-intolerant species declined with increasing P. undulatum.
The recruitment of shade-intolerant species was on average greater following
the removal of all P. undulatum compared with the removal of only
P.
undulatum tree, whereas there was no significant difference with shade-tolerant
species.
There was no recruitment of
P.
undulatum in seven of the Undisturbed Control plots. In both
the Remove all P. undulatum and Remove P. undulatum Trees
treatments the recruitment of P. undulatum increased greatly with
increasing amounts of P. undulatum removed, reaching 2144 recruits
in plot 20 (107.2 seedlings m-2).
Analyses of the effect of
P.
undulatum removal on the growth and survival of those seedlings already
present at the pre-treatment enumeration ("advance regeneration") show
much less clear results. In brief, those few seedlings that were beneath
dense P. undulatum were shade-tolerant species, mostly Eugenia
virgultosa, and these showed little sign of increased growth; indeed
in one plot (plot 20, south-eastern aspect, thin soils) from which all
P.
undulatum was removed (comprising 17.5% of the total basal area) most
of the advance regeneration either died or died back. In less heavily invaded
forest there was a greater diversity of advance regeneration but the removal
of P. undulatum led to a lesser opening up of the canopy, so effects
were slight.
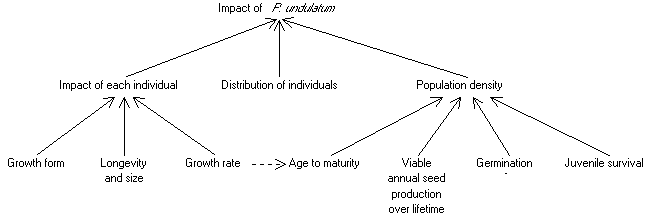
3. Mechanisms
This chapter examines
the reasons for the effect of P. undulatum, Figure 7 showing our
current understanding. We give a rather detailed account of our research
into the comparative growth form of P. undulatum and native species
as we think this may be one of the most important factors affecting the
success of P. undulatum, and all the fieldwork and analysis on this
subject was conducted during the Darwin Initiative project. The reference
in Figure 7 to the distribution of P. undulatum indicates the importance
of the spatial dimension to the invasion, but is a subject largely outside
the scope of this report.
Figure
7. Factors determining the impact of P.
undulatum
3.1
Methods
3.1.1
Growth rate
In
this section we compare the growth rate of P. undulatum trees with
those of native trees. We use trees in three plot series, those of E.V.J.
Tanner, P.J. Bellingham and the Heavily Invaded Forest Experiment (Undisturbed
Control plots only).
Table 4. Number
of plots, total area (ha), and mean enumeration dates and intervals of
the three series of plots
number area t0 t1 years
E.V.J. Tanner plots1
40 0.400 14/03/91 08/08/94 3.405
P.J. Bellingham stratified
plots 15 0.300 10/08/90 10/09/94 4.089
HIFE Undisturbed Control
plots 10 0.144 14/08/91 09/07/96 4.905
1
Col, Mull Ridge, Wet slope
The tree threshold
size is 3 cm DBH (7.0685 cm2 BA). The relative basal area increment
(RBAI) was calculated as follows:
RBAI = (lnBAt1
- lnBAt0) / t1-t0
where BA is
in m2, and t is time in years.
All results
are given by size class. Five size classes were chosen to contain approximately
the same number of individuals in each class, the size thresholds are:
Size class BA
(cm2)
1 7.07-11.99
2 12.00-19.99
3 20.00-39.99
4 40.00-124.99
5 >125.00
As well as analysing
data for individual species we grouped species into regeneration classes
(mostly based on a number of independent field studies (Sugden et al.
1985, Healey 1990, Vernon 1991, Dalling 1992)):
GD gap-demanding
- gaps or severe canopy disturbance essential for germination and recruitment
GB gap-benefitting
- some disturbance necessary for germination and recruitment
SGP slow-growing
pioneer - species with regeneration usually confined to habitats such as
landslides
ST shade-tolerant
- species relatively more successful as seedlings in undisturbed conditions
than gaps
U unclassified
- minor species for which we do not have sufficient information to confidently
classify
3.1.2
Growth form
Above-ground growth form
During July 1995 we started
two studies of the ability of common species to exploit and explore the
above-ground environment. Both studies were carried out in forest that
showed a range of disturbance from moderately disturbed (mostly by Hurricane
Gilbert seven years previously) to very undisturbed. It is important to
note that areas of severe or recent disturbance (or well-defined gaps)
were not included. Some bias is likely, as those more gap-benefitting species
were more likely to be growing in areas that experienced higher light levels
in the past, even if the light levels were fairly uniform throughout the
plots in 1995.
The first study was directed
at looking at the effect of P. undulatum trees on the above-ground
growth form of large seedlings (between 1 and 3 metres tall) of common
native species and P. undulatum itself. The species were chosen
for commoness and from three "regeneration groups" - Gap demanding,
Gap
benefitting and Shade tolerant. The seedlings were sampled in
the Undisturbed Control and Remove all P. undulatum treatments
of SIFE, all beneath the crowns of P. undulatum saplings (which
were subsequently removed of course in the latter treatment). The seedlings
were not confined to the plot itself but were often in the treatment area,
and were tagged and flagged for later relocation. The parameters measured
were:
-
Distance and compass bearing
from the P. undulatum sapling
-
Length of stem (to leaf tip)
-
Length to first living leaf
-
Maximum distance in each of four
quadrants (see Figure 8)
-
Angle of stem from the horizontal
-
Number of leaves; on Eugenia
virgultosa and on larger individuals of E. monticola the number
was estimated by counting the number on randomly selected branches
In 1996 between 10-20 leaves
per species (depending on the within-species variability) were collected
from large seedlings of each species just outside the plots in similar
forest. The area of the fresh leaves was estimated by measuring the mean
length and breadth of each leaf. Although the aspect of the slope on which
each individual occurred was measured, this factor is unlikely to have
been significant, as the slopes in the SIFE plots are gentle, between 0-10o.

Figure 8. Method
of measuring branch extension. The maximum distance that any living part
of any branch reaches to the NE, SE, SW and NW from the stem was measured,
such as distance a in the NE quadrant.
In the second study we investigated
the same aspects of the growth of a slightly wider range of species, this
was possible because of the much larger area within the SIFE plots not
beneath the crowns of P. undulatum. The differences were that:
-
the seedlings were not beneath
the crowns of P. undulatum saplings or trees
-
they were all within the marked
subplots (therefore their heights were measured in 1994 and will be in
future enumerations)
-
as the x-y coordinates were recorded,
the seedling density, i.e. the extent of interference from neighbours,
can be calculated.
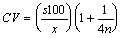
The coefficient of variation
(CV) of branch extension was calculated, using a correction for bias (Sokal
& Rohlf 1981):
Data were collected from a
total of 18 species in the two studies, but in the figures, results are
just shown for 15 of these, the five commonest gap-demanding, gap-benefitting
and shade-tolerant species.
Maximum DBH of each species
The maximum DBH of any individual
stem in any plot at any enumeration for each of 119 species (those present
in at least one of the 144 permanent sample plots) was calculated. The
heights of trees have not been recorded in most of the plots in the Blue
Mountains and even when they have been the measurements have often not
been accurate (P.J. Bellingham, pers. comm., 1993), so we do not provide
an analysis of maximum heights here.
3.1.3 Population
density
Seedling survival. The
seedling survival of different species in the ten Undisturbed Control
plots in the Heavily Invaded Forest Experiment was calculated. Mortality
per year was calculated in the form:
m = 1-(N1/N0)1/t
where N0 and N1
are population counts at the beginning and end of the measurement interval,
and t is in years (Sheil et al. 1995).
Maximum population density.
The maximum seedling density (m-2) per sub-plot in the 25 HIFE
plots and 12 SIFE plots (692 sub-plots altogether) reached by each of the
119 species occurring in at least one of the 144 permanent sample plots;
and the maximum tree density (m-2) reached by the same species
in any one of the 144 plots at any enumeration, was calculated.
Species dominance.
The summed heights of all seedlings in a plot or sub-plot is a useful measure
of dominance (Healey 1990). The heights of all seedlings in the 692 sub-plots
in the 37 HIFE and SIFE plots at the pre-treatment enumeration was summed,
and expressed as a density per square metre. The maximum value for all
89 species occuring as a seedling in either HIFE or SIFE was calculated.
3.2
Results
3.2.1
Growth rate
The relative basal area increment
(RBAI) between 1991 and 1994 of the five regeneration classes in the Tanner
(Col, Mull Ridge and North slope) plots, Bellingham stratified plots and
HIFE Undisturbed Control plots is shown in Figure 9.
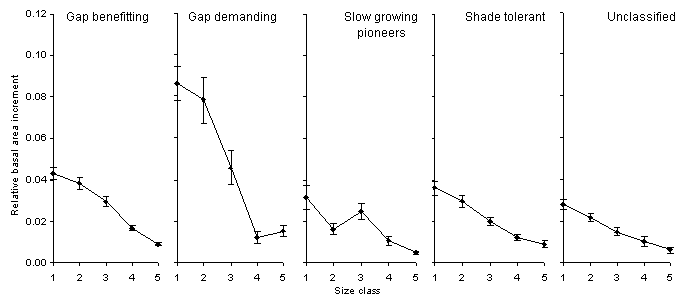
Figure 9. Mean (and
standard error of mean) relative basal area increment of five size classes
of different regeneration classes between 1991 and 1994 in the Tanner Col,
Mull ridge and Wet slope plots, Bellingham stratified plots and the Undisturbed
Control plots of HIFE.
The RBAI declines with increasing
size as would be expected, with an increase from Size class 2 to 3 for
the Slow growing pioneer class, largely due to the RBAI of Cyrilla racemiflora,
shown in Figure 10). The similarity in RBAI between the gap-benefitting,
shade-tolerant and slow growing pioneers trees is interesting, given the
very different growth rates of seedlings of these classes. There are few
small stems of gap-demanding species, mostly because of the lack of disturbance
of these forests between Hurricane Hazel in 1951 and H. Gilbert in 1988.
No individuals of gap-demanding species recruited as a result of H. Gilbert
had reached tree size by 1991.
The RBAI between 1991 and
1994 of P. undulatum and the nine commonest native species (all
species with >100 stems) in the same Tanner (Col, Mull Ridge and North
slope) plots, Bellingham stratified plots and HIFE Undisturbed Control
plots is shown in Figure 10.
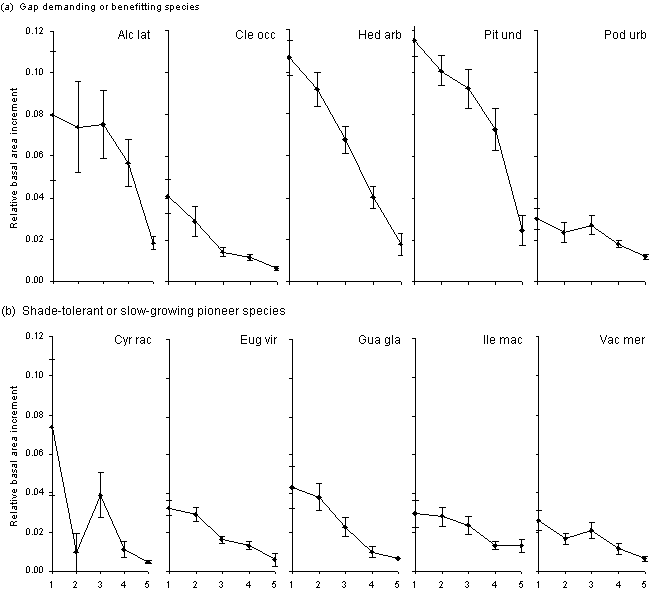
Figure 10. Mean
(and standard error of mean) relative basal area increment of five size
classes of ten species between 1991 and 1994 in the Tanner Col, Mull ridge
and Wet slope plots, Bellingham stratified plots and the Undisturbed Control
plots of HIFE. The species are divided into (a) gap demanding or benefitting
species, and (b) shade-tolerant or slow-growing pioneer species
The most striking result is
the high RBAI of some gap demanding or benefitting species compared with
the dominant tree species Clethra occidentalis, Podocarpus urbanii,
Eugenia
virgultosa, and Vaccinium meridionale. Hedyosmum arborescens
was the only species of these nine to have a growth pattern similar to
that of P. undulatum, although the growth rate of P. undulatum
was higher than H. arborescens for all size classes, particularly
the middle size classes. H. arborescens is a relatively short-lived,
though medium sized, tree. A higher proportion of H. arborescens
trees were killed by Hurricane Gilbert than any other of the 47 commonest
tree species (Bellingham et al. 1995).
The high variability of growth
of small stems of Alchornea latifolia and Cyrilla racemiflora
is partly due to the common occurrence of large sprouts from the trunk
of large trees of these species. These sprouts can sometimes grow very
fast, significantly faster than individual small trees of the same species
and size in the same environment. But this is not so for all species which
produce many sprouts. For example Ilex macfadyenii produces a higher
number of sprouts (that reach 3 cm DBH) than any other species, but sprouts
as well as main stems grow slowly.
The results of an analysis
of P. undulatum and native seedling growth (not presented here)
show a similar pattern, with P. undulatum consistently having a
faster mean growth than almost all native species. In four experimentally
created gaps however a small number of native species (particularly Brunellia
comocladiifolia and Miconia dodecandra) grew faster as juveniles
and small trees than P. undulatum. Both of these species can be
described as pioneer trees typical of lowland tropical rain forest. B.
comocladiifolia can become a large tree (>50 cm DBH) but its regeneration
is confined to areas of high disturbance and is uncommon in forest (occurring
at a mean density of only 1.59 stems per hectare in our permanent sample
plots). M. dodecandra is a small, even less common tree, and is
similarly confined to disturbed areas.
3.2.2
Growth form
Mean crown extension of large
seedlings
The relationship between the
height and the mean crown extension of the large seedlings is shown in
Figure 11 overleaf.
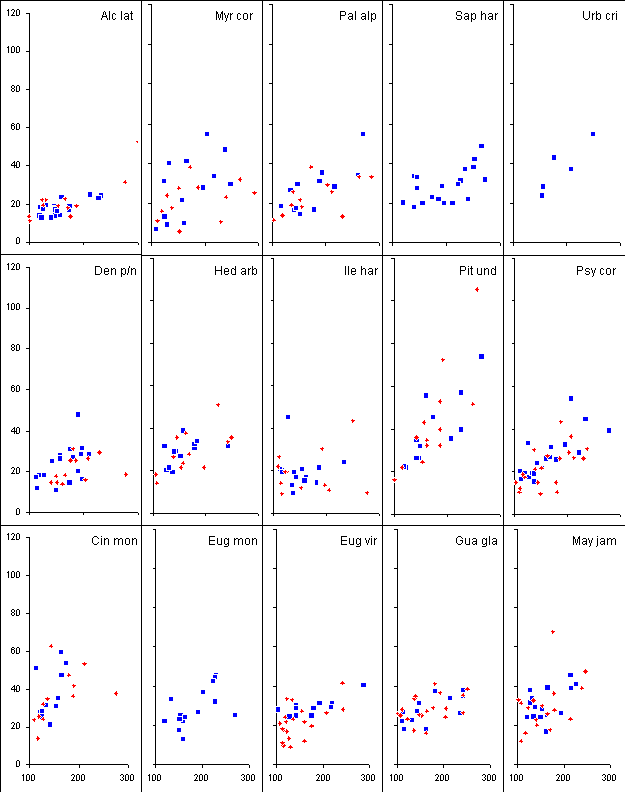
Figure 11. Relationship
between the height (cm, on the x-axis) and the mean branch extension (cm,
on the y-axis) of large (100-300 cm) seedlings of 15 species. Blue diamonds
represent individuals not growing directly beneath the crown of P.
undulatum trees, whereas red crosses represent individuals beneath P.
undulatum trees. The top five species are gap demanding, the middle
five are gap benefitting and the bottom five are shade tolerant. Mean branch
extension on the y-axis, height on the x-axis, both in cm.
It is evident that the steepness
of the regression relationship between height and mean crown extension
is greater for P. undulatum than for any native species and that
the relationship is a relatively close one (the data has not yet been statistically
analysed). Urbananthus critoniforme (a small short-lived near-pioneer
tree) is the only one of these native species to show a similar increase
in branch extension with increasing size, though unfortunately it was not
possible to find more individuals in the SIFE plots to make the relationship
clearer. Overall there is no obvious difference between gap-demanding,
gap-benefitting and shade-tolerant species. Note that the gap-benefitting
class includes species with a wide degree of response to gap formation,
from species clearly greatly favoured by disturbance (for example Hedyosmum
arborescens) to species apparently little affected (for example Ilex
harrisii). Of the shade-tolerant species three of the commonest (Eugenia
virgultosa, E. monticola and Guarea glabra) show a noticeably
similar relationship. Cinnamomum montanum has a particularly extensive
crown.
Myrsine coriacea shows
a much greater degree of variability in mean branch extension for a given
height than P. undulatum or native species such as Hedyosmum
arborescens or Alchornea latifolia. M. coriacea is a
species that has branches that fail to grow if the light intensity from
the side, or if inter-plant competition, is intense (leafless dying-back
branches are common). In these situations M. coriacea seedlings
appear (above-ground) to put all their resources into height growth.
Table 5. Mean crown
area (m2); maximum branch extension as a percentage of the individual's
height for any individual; mean of the coefficient of variation (CV) of
branch extension for each individual; mean of the height:crown diameter
ratio for each individual; mean Leaf Area Index (LAI); and mean crown volume
(m3) for the 18 species
| Species |
Mean crown area (m2) |
Max. branch extension as % of height |
Mean CV of branch extension |
Mean height/ crown diam. ratio |
Mean LAI |
Mean crown volume (m3) |
| Alchornea latifolia |
0.09 |
28.3 |
25 |
4.28 |
3.15 |
0.02 |
| Cinnamomum montanum |
0.29 |
55.2 |
26 |
2.26 |
1.07 |
0.09 |
| Clethra occidentalis |
0.23 |
41.7 |
38 |
2.60 |
1.11 |
0.04 |
| Dendropanax pen/nut |
0.11 |
37.9 |
31 |
4.18 |
1.84 |
0.02 |
| Eugenia monticola |
0.18 |
31.6 |
29 |
3.38 |
2.48 |
0.09 |
| Eugenia virgultosa |
0.13 |
44.9 |
40 |
3.48 |
0.89 |
0.04 |
| Guarea glabra |
0.16 |
54.5 |
37 |
3.04 |
1.45 |
0.04 |
| Hedyosmum arborescens |
0.18 |
37.0 |
34 |
2.93 |
1.71 |
0.06 |
| Ilex harrisii |
0.09 |
46.8 |
46 |
4.73 |
3.88 |
0.02 |
| Maytenus jamaicensis |
0.20 |
58.5 |
37 |
2.82 |
2.06 |
0.06 |
| Mecranium purpurascens |
0.10 |
39.0 |
41 |
3.89 |
0.99 |
0.03 |
| Myrsine coriacea |
0.20 |
47.4 |
42 |
4.46 |
0.94 |
0.06 |
| Palicourea alpina |
0.14 |
47.1 |
47 |
3.85 |
1.41 |
0.04 |
| Pittosporum undulatum |
0.41 |
69.3 |
43 |
2.29 |
1.39 |
0.17 |
| Psychotria corymbosa |
0.13 |
40.1 |
47 |
3.65 |
1.06 |
0.04 |
| Sapium harrisii |
0.17 |
27.7 |
18 |
3.62 |
1.51 |
0.06 |
| Sideroxylon montanum |
0.31 |
49.7 |
25 |
2.52 |
1.84 |
0.11 |
| Urbananthus critoniformis |
0.30 |
29.0 |
28 |
2.62 |
1.67 |
0.08 |
| Native species |
0.17 |
58.5 |
36 |
3.52 |
1.72 |
0.05 |
The mean branch extension
of P. undulatum was 4 cm greater than the mean branch extension
of any native species, and 14.6 cm (54.3%) greater than the mean for all
native species. The maximum branch extension of P. undulatum was
25 cm longer than that of any branch of any native species, or when extensions
are expressed as a percentage of seedling height (column 3), over 10% greater
than that of any native species. The height:crown diameter ratio (column
5) of P. undulatum was 2.29, just above Cinnamomum montanum,
i.e. both these species have a very broad crown for a given height. The
mean L.A.I. of P. undulatum was near the average for all species,
the high leaf area per individual (Fig. 13) being distributed over a larger
crown area than native species (column 2). The high crown area of P.
undulatum combined with its deep crown (Fig. 12) to give a mean crown
volume over three times the mean for native species combined.
Variability of branch extension
The ability to efficiently
exploit above-ground resources depends on the degree to which plants can
increase their lateral growth towards areas of higher resource availability.
The light environment in many areas of the Blue Mountains has been highly
spatially variable since Hurricane Gilbert, with many gaps created by the
fall of large branches or trees, or the later death of standing damaged
trees (though most of these gaps have now "filled in"). As the distance
of branching was measured in four directions for each seedling we have
been able to calculate the coefficient of variation of branch length for
each individual plant and derive the mean for each species, shown in Table
5 (column 4).
P. undulatum had the
third highest value, lower than the two gap demanding or benefitting species
Palicourea
alpina and Psychotria corymbosa. The mean branch extension of
both these native species is only about 60% that of P. undulatum
and their high degree of variability in branch extension is partly due
to a failure of some seedlings to produce branches in some directions.
Whether this was a failure to produce a branch, mechanical damage to a
developing branch (P. corymbosa is very weak stemmed) or a "tactical"
exploitation of resources by the plant (effected by a diversion of resources
into those branches produced on the side of the plant experiencing higher
light levels) we cannot say. Such a tactical explanation seems more likely
with P. alpina than with P. corymbosa, and very likely with
P.
undulatum.
Crown depth of large seedlings
The crown depth of the seedlings
is shown in Figure 12 on the next page. It would be expected that, for
individuals with equal leaf area, those with deep crowns would collect
less light from vertically above and more sidelight, hence deep crowns
would be more prevalent in shade-tolerant species. For these 15 species
the relationships are not at all clear, though there appears to be some
evidence to support this hypothesis. Shade-tolerant Eugenia monticola
had a consistently deep crown, whereas the gap-demanding Alchornea latifolia
had a consistently shallow crown. The deep crowns of Sapium harrisii
and Palicourea alpina are rather deceptive, as both species can
retain leaves produced on the main stem early in growth, and whether the
crown can really be said to extend this low is questionable. Hedyosmum
arborescens had a very similar regression relationship to P. undulatum,
both having a rather consistently deep crown. Both Eugenia virgultosa
(probably the most shade-tolerant of these species) and Myrsine coriacea
(one of the least shade-tolerant species) had very variable crown depths.
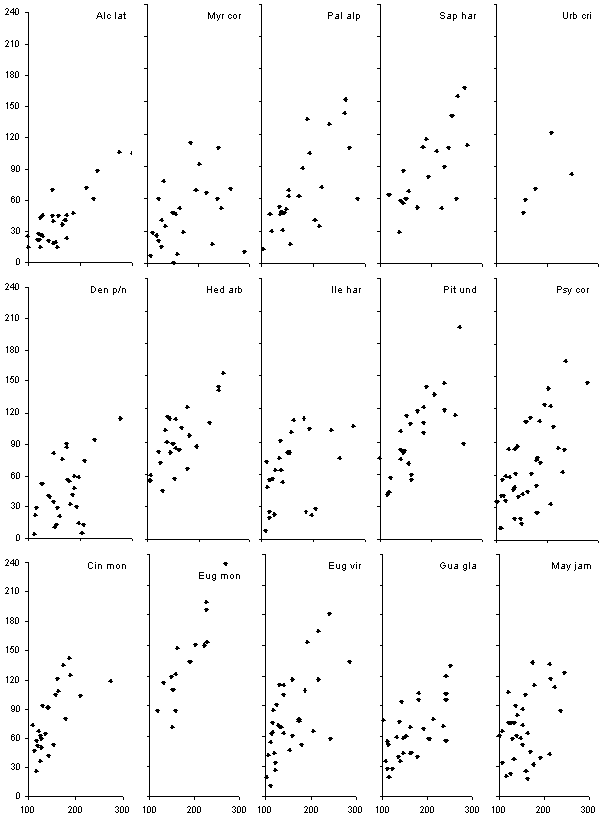
Figure 12. The relationship
between seedling height (cm, on the x-axis) and the crown depth (cm, on
the y-axis), for each large seedling of the 15 species.
Crown depth was calculated as total height minus height to the lowest living
leaf.
Leaf area of large seedlings
The relationship between the
height of the saplings and the total leaf area is shown in Figure 13.
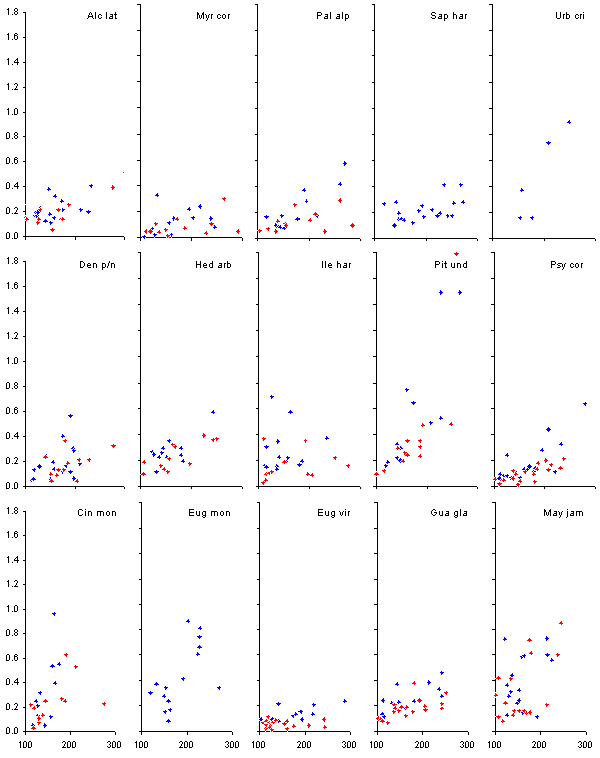
Figure 13. The relationship
between the height (cm, on the x-axis) and the total leaf area (m2,
on the y-axis) of large seedlings of 15 species. Blue diamonds represent
individuals not growing directly beneath the crown of P.
undulatum trees, whereas red crosses represent individuals growing beneath
P.
undulatum trees. The top five species are gap demanding, the middle
five are gap benefitting and the bottom five are shade tolerant.
In general the mean leaf area
per species increased in the order gap-demanding < gap-benefitting <
shade-tolerant, with much variation between species within class. The leaf
area of P. undulatum was strikingly higher than any native species
(again with the possible exception of Urbananthus critoniforme).
The shade-tolerant Maytenus jamaicensis had a noticeably high leaf
area. Although the slopes of the regression relationship of Alchornea
latifolia and Sapium harrisii are similar to Palicourea alpina,
Psychotria
corymbosa and Myrsine coriacea the leaves of both species are
significantly larger, partly explaining why their slopes intercept the
y-axis at a higher level than the other three gap favoured species. The
difference between the congenerics Eugenia monticola and E. virgultosa
is very noticeable. The two species had almost identical mean branch extensions,
whereas E. monticola had a consistently deeper crown than E.
virgultosa, but the most noteworthy difference between them is the
different leaf sizes (a mean of 0.0004 m2 for
E. virgultosa
and 0.0018 m2 for E. monticola).
Maximum DBH of each species
The maximum DBH of any tree
for each of the 116 species occurring as a tree in at least one of the
144 plots permanent sample plots in the Blue Mountains is shown in Table
6. The small size of the trees compared with lowland tropical rain forest
is obvious but is typical of montane forests (Grubb & Tanner 1976).
Larger trees occur outside plots of course, the largest typically-shaped
native tree (a Sapium harrisii) so far encountered having a DBH
of 97 cm. The largest P. undulatum had a DBH of 41.8 cm, the 21st
in rank, and the DBH of the largest measured P. undulatum outside
plots was 65.6 cm. Judged by the size of crowns we think that a few significantly
larger P. undulatum trees occur on a remote hillside which we have
never been able to visit.
Table 6. The maximum
DBH (cm) of any tree for each of the 116 species occurring as a tree in
at least one of the 144 plots permanent sample plots in the Blue Mountains.
|
Species |
DBH
|
|
Species |
DBH
|
|
Species |
DBH
|
|
Species |
DBH
|
|
Jun luc |
75.0 |
|
Eug mon |
30.5 |
|
Cya woo |
14.1 |
|
Cli ter |
6.4 |
|
Alc lat |
71.9 |
|
Rha sph |
29.2 |
|
Den pen |
13.9 |
|
Bid shr |
6.3 |
|
Sid mon |
71.3 |
|
Den nut |
28.3 |
|
Psy cor |
13.8 |
|
Con mon |
5.7 |
|
Tur occ |
68.1 |
|
Clu hav |
28.1 |
|
Cal rig |
13.7 |
|
Tou gla |
5.5 |
|
Hae inc |
61.0 |
|
Sym oct |
27.8 |
|
Lyo jam |
13.0 |
|
Sch inv |
5.5 |
|
Pod urb |
58.2 |
|
Cle the |
27.5 |
|
Psy slo |
12.5 |
|
Mal arb |
5.3 |
|
Vac mer |
57.1 |
|
Ile mac |
27.1 |
|
Cle oxa |
12.2 |
|
Boc fru |
5.1 |
|
Gor hae |
55.8 |
|
Myr cor |
26.7 |
|
Xyl nit |
12.0 |
|
Oss asp |
5.1 |
|
Cyr rac |
55.4 |
|
Hed arb |
26.6 |
|
Tre flo |
11.8 |
|
Pip arb |
5.0 |
|
Gua gla |
52.8 |
|
Vib spp |
26.5 |
|
Ges alp |
11.4 |
|
Ure ela |
4.7 |
|
Sol pun |
52.7 |
|
B1 mel |
25.4 |
|
Vib vil |
11.3 |
|
Bla tri |
4.6 |
|
Cle occ |
52.5 |
|
Ile har |
25.2 |
|
Per alp |
11.0 |
|
Aca vir |
4.3 |
|
Sap har |
52.3 |
|
Ile obc |
24.2 |
|
Mar bro |
10.8 |
|
Lob ass |
3.8 |
|
Myr cer |
51.1 |
|
Den p/n |
24.0 |
|
Cri par |
10.4 |
|
Wei pin |
3.7 |
|
Bru com |
50.1 |
|
Ile vac |
23.8 |
|
Mec pur |
10.4 |
|
Wal faw |
3.6 |
|
Den arb |
47.7 |
|
Eug har |
23.8 |
|
Mer leu |
10.2 |
|
Dur ere |
3.4 |
|
Cha glo |
44.7 |
|
Cin pub |
23.7 |
|
Cya con |
9.9 |
|
Bes lut |
3.4 |
|
Cin mon |
44.6 |
|
Gar fad |
23.1 |
|
Bru jam |
9.8 |
|
Sal sca |
3.1 |
|
May jam |
44.1 |
|
Eug mar |
23.0 |
|
Ces hir |
9.4 |
|
Lob mar |
3.0 |
|
Lyo oct |
43.0 |
|
Sch sci |
21.4 |
|
Mic rig |
9.1 |
|
Pip fad |
3.0 |
|
Pit und |
41.8 |
|
Eug vir |
20.4 |
|
Phy arb |
8.8 |
|
Mic dod |
2.5 |
|
Cle ale |
38.5 |
|
Mer pur |
20.1 |
|
Boe cau |
8.3 |
|
Ver plu |
1.9 |
|
Cit cau |
37.2 |
|
Wal cal |
19.7 |
|
Pic ant |
7.9 |
|
Phe hir |
1.1 |
|
Ile nit |
36.6 |
|
Eug bra |
18.9 |
|
Urb cri |
7.7 |
|
Koa har |
1.0 |
|
Myr acr |
34.4 |
|
Cin off |
17.8 |
|
Wal cra |
7.6 |
|
Met spp |
0.9 |
|
Vib alp |
33.6 |
|
Mic the |
17.4 |
|
Cas vim |
7.5 |
|
Smi bal |
0.8 |
|
Myr fra |
33.6 |
|
Cya fur |
17.2 |
|
Pit vir |
7.1 |
|
Mik max |
0.7 |
|
Oco pat |
33.3 |
|
Mic qua |
17.1 |
|
Odo fad |
6.6 |
|
Com cli |
0.6 |
|
Cya pub |
31.8 |
|
Pru occ |
16.7 |
|
Cal fer |
6.5 |
|
Pas pen |
0.5 |
3.2.3 Population
density
Seedling survival
The mortality
of P. undulatum and native species classified into regeneration
groups is shown in Figure 14 and is shown for all native species with over
ten individuals in Table 7.
Table
7. Annual mortality rate of five size classes of P.
undulatum, all individual native species with over ten individuals and
four regeneration groups of native species (in bold) in the ten Undisturbed
Control plots in HIFE between 1991 and 94; results are in the sequence
of decreasing overall mortality. RG = regeneration group. The five size
classes are, in cm: 1 <10, 2 10-19, 3 20-49, 4
50-99, 5 >100 cm.
|
|
Number of seedlings in 1991 |
Annual mortality rate |
|
|
|
| Species/class |
RG |
1 |
2 |
3 |
4 |
5 |
all |
1 |
2 |
3 |
4 |
5 |
all |
| Turpinia occidentalis |
GB |
6 |
15 |
5 |
0 |
0 |
26 |
0.365 |
0.421 |
0.191 |
|
|
0.356 |
| Alchornea latifolia |
GD |
14 |
19 |
5 |
0 |
0 |
38 |
0.472 |
0.233 |
0.088 |
|
|
0.283 |
| Gap demanding |
|
27 |
29 |
11 |
2 |
0 |
69 |
0.337 |
0.198 |
0.080 |
0.000 |
|
0.219 |
| Podocarpus urbanii |
GB |
3 |
1 |
1 |
2 |
3 |
10 |
0.365 |
0.000 |
1.000 |
0.250 |
0.000 |
0.191 |
| Psychotria corymbosa |
GB |
169 |
85 |
24 |
17 |
24 |
319 |
0.266 |
0.094 |
0.035 |
0.051 |
0.035 |
0.166 |
| Clethra occidentalis |
GB |
9 |
5 |
0 |
2 |
1 |
17 |
0.285 |
0.088 |
|
0.000 |
0.000 |
0.165 |
| Gap benefitting |
|
249 |
142 |
57 |
36 |
46 |
530 |
0.229 |
0.107 |
0.053 |
0.048 |
0.028 |
0.142 |
| Palicourea alpina |
GD |
7 |
7 |
3 |
1 |
0 |
18 |
0.130 |
0.130 |
0.155 |
0.000 |
|
0.126 |
| Myrsine coriacea |
GB |
28 |
9 |
7 |
1 |
4 |
49 |
0.148 |
0.099 |
0.130 |
0.000 |
0.000 |
0.120 |
| Citharexylum caudatum |
U |
10 |
2 |
3 |
1 |
1 |
17 |
0.088 |
1.000 |
0.000 |
0.000 |
0.000 |
0.105 |
| Ilex harrisii |
GB |
6 |
1 |
0 |
3 |
3 |
13 |
0.250 |
0.000 |
|
0.000 |
0.000 |
0.103 |
| Smilax balbisiana |
U |
10 |
6 |
7 |
2 |
4 |
29 |
0.191 |
0.073 |
0.062 |
0.000 |
0.000 |
0.092 |
| Prunus occidentalis |
ST |
0 |
3 |
9 |
1 |
8 |
21 |
|
0.000 |
0.155 |
1.000 |
0.000 |
0.084 |
| Eugenia virgultosa |
ST |
206 |
133 |
87 |
49 |
26 |
501 |
0.130 |
0.072 |
0.044 |
0.009 |
0.016 |
0.081 |
| Xylosma nitida |
U |
3 |
3 |
9 |
3 |
4 |
22 |
0.365 |
0.155 |
0.048 |
0.000 |
0.000 |
0.080 |
| Pittosporum undulatum |
GB |
414 |
435 |
369 |
269 |
307 |
1794 |
0.175 |
0.094 |
0.039 |
0.005 |
0.005 |
0.070 |
| Myrcianthes fragrans |
U |
135 |
10 |
13 |
9 |
2 |
169 |
0.085 |
0.000 |
0.033 |
0.000 |
0.000 |
0.070 |
| Shade tolerant |
|
383 |
244 |
153 |
96 |
72 |
948 |
0.116 |
0.055 |
0.042 |
0.017 |
0.006 |
0.069 |
| Cinnamomum montanum |
ST |
5 |
6 |
10 |
11 |
4 |
36 |
0.088 |
0.073 |
0.088 |
0.039 |
0.000 |
0.060 |
| Unclassified |
|
277 |
76 |
96 |
60 |
73 |
582 |
0.084 |
0.051 |
0.040 |
0.007 |
0.000 |
0.053 |
| Psychotria sloanei |
U |
89 |
11 |
5 |
0 |
4 |
109 |
0.058 |
0.039 |
0.000 |
|
0.000 |
0.051 |
| Guarea glabra |
ST |
2 |
11 |
10 |
4 |
3 |
30 |
0.250 |
0.080 |
0.000 |
0.000 |
0.000 |
0.043 |
| Cassia viminea |
GB |
21 |
17 |
17 |
5 |
1 |
61 |
0.084 |
0.051 |
0.000 |
0.000 |
0.000 |
0.042 |
| Ocotea patens |
ST |
5 |
4 |
22 |
11 |
10 |
52 |
0.000 |
0.000 |
0.039 |
0.000 |
0.000 |
0.016 |
| Maytenus jamaicensis |
ST |
13 |
10 |
1 |
2 |
2 |
28 |
0.033 |
0.000 |
0.000 |
0.000 |
0.000 |
0.015 |
| Eugenia monticola |
ST |
43 |
51 |
33 |
25 |
26 |
178 |
0.010 |
0.016 |
0.000 |
0.000 |
0.000 |
0.007 |
| Eugenia harrisii |
U |
4 |
12 |
8 |
14 |
31 |
69 |
0.000 |
0.035 |
0.000 |
0.000 |
0.000 |
0.006 |
| Vernonia pluvialis |
U |
1 |
6 |
10 |
9 |
7 |
33 |
0.000 |
0.000 |
0.000 |
0.000 |
0.000 |
0.000 |
| Eugenia marchiana |
ST |
10 |
7 |
1 |
1 |
0 |
19 |
0.000 |
0.000 |
0.000 |
0.000 |
|
0.000 |
| Malvaviscus arboreus |
GB |
4 |
7 |
3 |
1 |
0 |
15 |
0.000 |
0.000 |
0.000 |
0.000 |
|
0.000 |
| Picramnia antidesma |
U |
3 |
9 |
0 |
1 |
0 |
13 |
0.000 |
0.000 |
|
0.000 |
|
0.000 |
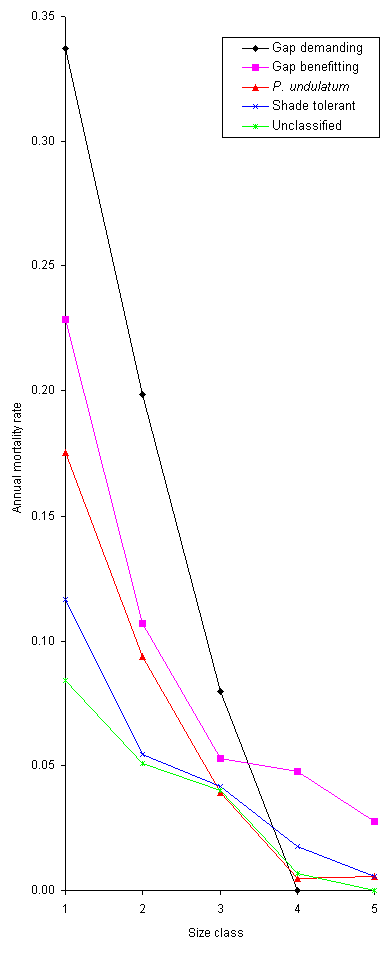
Figure 14. Annual
mortality rate between 1991-93 of seedlings of P.
undulatum, and those of native species classified into four regeneration
groups, in 10 Undisturbed Control plots in HIFE; see text for an explanation
of how annual mortality was calculated.
The mortality rate for smaller
seedlings was greater than that for larger seedlings for P. undulatum
and all regeneration groups. Shade-tolerant species generally had lower
mortality, though two climber/scramblers classified as gap benefitting
(Cassia viminea and Malvaviscus arboreus) had a lower overall
mortality than the mean for all shade-tolerant species. The mortality rate
of Eugenia monticola was only about one-tenth that of E. virgultosa.
There was a low density of gap-demanding species (many of those that were
present were recruited by Hurricane Gilbert); there were no seedlings of
the gap-demanding class in the largest size class.
The mortality rate for all
size classes of P. undulatum was very similar to gap-benefitting
native species, the group which P. undulatum would be placed into,
based on growth rate criteria. For the largest three size classes the mortality
of P. undulatum was less than that of the mean for shade-tolerant
species. Of the 24 native tree species with >10 individuals, all those
classified as gap demanding or gap benefitting (and some classified as
shade-tolerant) had a higher overall mortality than P. undulatum.
Maximum population density
The maximum seedling density
(m-2) per sub-plot in the 37 HIFE and SIFE plots reached by
each of the 119 species occurring in at least one of the 144 permanent
sample plots; and the maximum tree density (m-2) reached by
the same species in any one of the 144 plots at any enumeration is shown
in Table 8.
Table 8. The maximum
seedling density (m-2) per sub-plot in the 37 HIFE and SIFE
plots reached by each of the 119 species occurring in at least one of the
144 permanent sample plots in the western Blue Mountains; and the maximum
tree density (m-2) reached by the same species in any one of
the 144 plots at any enumeration. The species are arranged in order of
decreasing seedling density within each column.
| Species |
Sdlgs |
Trees |
|
Species |
Sdlgs |
Trees |
|
Species |
Sdlgs |
Trees |
| Eugenia virgultosa |
215.97 |
0.347 |
|
Wallenia calyptrata |
3.00 |
0.050 |
|
Cionosicys pomiformis |
0.69 |
0.000 |
| Pittosporum undulatum |
197.00 |
0.306 |
|
Malvaviscus arboreus |
3.00 |
0.030 |
|
Gonolobus jamaicensis |
0.69 |
0.000 |
| Maytenus jamaicensis |
47.22 |
0.076 |
|
Miconia theaezans |
3.00 |
0.008 |
|
Gonolobus stapelioides |
0.69 |
0.000 |
| Myrcianthes fragrans |
43.00 |
0.042 |
|
Passiflora penduliflora |
2.78 |
0.000 |
|
Ilex vaccinoides |
0.69 |
0.030 |
| Clethra occidentalis |
40.28 |
0.175 |
|
Ilex obcordata |
2.78 |
0.080 |
|
Marcgravia brownei |
0.69 |
0.024 |
| Psychotria corymbosa |
29.00 |
0.095 |
|
Symplocos octopetala |
2.78 |
0.020 |
|
Conostegia montana |
0.69 |
0.020 |
| Eugenia monticola |
26.00 |
0.192 |
|
Acalypha virgata |
2.78 |
0.017 |
|
Persea alpigena |
0.69 |
0.020 |
| Alchornea latifolia |
22.92 |
0.110 |
|
Wallenia fawcettii |
2.78 |
0.010 |
|
Odontocline fadyenii |
0.69 |
0.011 |
| Guarea glabra |
18.75 |
0.165 |
|
Sideroxylon montanum |
2.08 |
0.050 |
|
Brunellia comocladiifolia |
0.69 |
0.008 |
| Psychotria sloanei |
16.00 |
0.125 |
|
Ilex harrisii |
2.08 |
0.049 |
|
Duranta erecta |
0.69 |
0.007 |
| Palicourea alpina |
15.28 |
0.165 |
|
Tournefortia glabra |
2.08 |
0.003 |
|
Lyonia octandra |
0.00 |
0.370 |
| Eugenia marchiana |
15.28 |
0.049 |
|
Calyptranthes rigida |
2.00 |
0.060 |
|
Cyathea pubescens |
0.00 |
0.173 |
| Mecranium purpurascens |
11.11 |
0.080 |
|
Miconia quadrangularis |
2.00 |
0.050 |
|
Clethra alexandra |
0.00 |
0.130 |
| Cassia viminea |
9.72 |
0.020 |
|
Urbananthus critoniformis |
2.00 |
0.050 |
|
Dendropanax pendulus |
0.00 |
0.120 |
| Myrsine coriacea |
9.00 |
0.069 |
|
Dendropanax arboreus |
2.00 |
0.040 |
|
Cyrilla racemiflora |
0.00 |
0.117 |
| Koanophyllon hardwarense |
7.64 |
0.000 |
|
Bidens shrevei |
2.00 |
0.021 |
|
Cyathea furfuracea |
0.00 |
0.110 |
| Hedyosmum arborescens |
7.64 |
0.150 |
|
Callicarpa ferruginea |
2.00 |
0.020 |
|
Juniperus lucayana |
0.00 |
0.100 |
| Sapium harrisii |
7.64 |
0.010 |
|
Rhamnus sphaerospermus |
2.00 |
0.015 |
|
Boehmeria caudata |
0.00 |
0.083 |
| Turpinia occidentalis |
6.94 |
0.083 |
|
Wallenia crassifolia |
2.00 |
0.015 |
|
Miconia rigida |
0.00 |
0.070 |
| Mannetia lygistum |
6.25 |
0.000 |
|
Dendropanax pen/nut |
1.39 |
0.000 |
|
Cleyera theaoides |
0.00 |
0.045 |
| Phyllanthus arbuscula |
6.25 |
0.051 |
|
Phenax hirtus |
1.39 |
0.000 |
|
Myrica cerifera |
0.00 |
0.042 |
| Cinnamomum montanum |
6.25 |
0.021 |
|
Vaccinium meridionale |
1.39 |
0.326 |
|
Bocconia frutescens |
0.00 |
0.033 |
| Meriania purpurea |
5.56 |
0.085 |
|
Solanum punctulatum |
1.39 |
0.050 |
|
Mecranium virgatum |
0.00 |
0.033 |
| Piper arboreum |
5.56 |
0.020 |
|
Haenianthus incrassatus |
1.39 |
0.030 |
|
Eugenia alpina |
0.00 |
0.030 |
| Salmea scandens |
4.17 |
0.000 |
|
Gordonia haematoxylum |
1.39 |
0.021 |
|
Schradera involucrata |
0.00 |
0.025 |
| Eugenia brachythrix |
4.17 |
0.017 |
|
Cestrum hirtum |
1.39 |
0.017 |
|
Cinchona pubescens |
0.00 |
0.021 |
| Lobelia assurgens |
4.17 |
0.005 |
|
Besleria lutea |
1.00 |
0.000 |
|
Cyathea woodwardioides |
0.00 |
0.020 |
| Smilax balbisiana |
4.00 |
0.000 |
|
Cissampelos pareira |
1.00 |
0.000 |
|
Lyonia jamaicensis |
0.00 |
0.017 |
| Podocarpus urbanii |
4.00 |
0.180 |
|
Daphnopsis americana |
1.00 |
0.000 |
|
Gesneria alpina |
0.00 |
0.015 |
| Eugenia harrisii |
4.00 |
0.132 |
|
Cinchona officinalis |
1.00 |
0.195 |
|
Urera elata |
0.00 |
0.015 |
| Citharexylum caudatum |
4.00 |
0.058 |
|
Ilex macfadyenii |
1.00 |
0.192 |
|
Clibadium terebinthinaceum |
0.00 |
0.014 |
| Brunfelsia jamaicensis |
4.00 |
0.044 |
|
Chaetocarpus globosus |
1.00 |
0.150 |
|
Cyathea concinna |
0.00 |
0.010 |
| Myrsine acrantha |
4.00 |
0.035 |
|
Clusia havetiodes |
1.00 |
0.120 |
|
Lobelia martagon |
0.00 |
0.010 |
| Ocotea patens |
4.00 |
0.035 |
|
Schefflera sciadophyllum |
1.00 |
0.083 |
|
Viburnum villosum |
0.00 |
0.010 |
| Prunus occidentalis |
4.00 |
0.021 |
|
Garrya fadyenii |
1.00 |
0.076 |
|
Weinmannia pinnata |
0.00 |
0.010 |
| Vernonia pluvialis |
3.47 |
0.000 |
|
Viburnum alpinum |
1.00 |
0.063 |
|
Ilex sideroxyloides |
0.00 |
0.007 |
| Picramnia antidesma |
3.47 |
0.028 |
|
Critonia parviflora |
1.00 |
0.060 |
|
Pittosporum viridiflorum |
0.00 |
0.007 |
| Piper fadyenii |
3.47 |
0.005 |
|
Meriania leucantha |
1.00 |
0.040 |
|
Ossaea asperifolia |
0.00 |
0.005 |
| Xylosma nitida |
3.00 |
0.066 |
|
Ilex nitida |
1.00 |
0.020 |
|
Dendropanax nutans |
0.00 |
0.002 |
|
|
|
|
Blakea trinerva |
1.00 |
0.010 |
|
Trema floridanum |
0.00 |
0.002 |
Eugenia virgultosa
was the only native species to occur at a similar high density to P.
undulatum. Of the other common species, Maytenus jamaicensis
is another shade-tolerant species common in primary forest; and Myrcianthes
fragrans is a species with an unusually clumped distribution - the
mean density in one plot was 8.05 seedlings m-2 compared with
a mean density in the other HIFE and SIFE plots of 0.21 seedlings m-2.
Recruitment of Clethra occidentalis is almost confined to the lower
stems of Cyathea tree ferns (Newton & Healey 1989), where it
can be dense. All the sub-plots in which seedlings were enumerated occured
in forest that was relatively undisturbed, and densities of several species
were much higher in gaps (Healey 1990). P. undulatum was one of
only four species to have a maximum tree density of over 200 stems per
hectares; Eugenia virgultosa is the commonest tree in the Blue Mountains,
whilst Vaccinium meridionale and especially Lyonia octandra
are abundant in the localised Mor Ridge forest, where both occur typically
as multi-stemmed individuals. Twelve of the 14 species occurring as seedlings
but not as trees were climbers that never reach 3 cm DBH. The maximum density
of saplings (stems >3 m high but <3 cm DBH) of P. undulatum was
0.605 m-2, nearly twice that of Eugenia virgultosa, the
densest native species - this data is not presented in full as saplings
were enumerated in only 59 of the 144 plots.
3.2.4
Species dominance
The maximum seedling dominance
for all 89 species occuring as a seedling is shown in Table 9.
Table 9. The maximum
seedling dominance (M.D.) per sub-plot (in terms of summed heights (m m-2))
of all 89 species occuring as seedlings in at least one of the 692 sub-plots
in HIFE or SIFE. The species are arranged in order of decreasing seedling
dominance within each column.
| Species |
M.D. |
|
Species |
M.D. |
|
Species |
M.D. |
| Pittosporum undulatum |
52.04 |
|
Ilex harrisii |
3.02 |
|
Eugenia brachythrix |
1.82 |
| Alchornea latifolia |
20.47 |
|
Dendropanax arboreus |
2.97 |
|
Brunfelsia jamaicensis |
1.81 |
| Koanophyllon hardwarense |
16.88 |
|
Citharexylum caudatum |
2.95 |
|
Turpinia occidentalis |
1.76 |
| Eugenia virgultosa |
15.35 |
|
Tournefortia glabra |
2.93 |
|
Daphnopsis americana |
1.60 |
| Mecranium purpurascens |
14.97 |
|
Mannetia lygistum |
2.84 |
|
Passiflora penduliflora |
1.60 |
| Eugenia monticola |
8.01 |
|
Myrsine coriacea |
2.80 |
|
Persea alpigena |
1.59 |
| Piper arboreum |
7.95 |
|
Psychotria sloanei |
2.80 |
|
Ilex macfadyenii |
1.54 |
| Psychotria corymbosa |
7.95 |
|
Chaetocarpus globosus |
2.75 |
|
Ilex obcordata |
1.54 |
| Guarea glabra |
7.63 |
|
Clusia havetiodes |
2.70 |
|
Phyllanthus arbuscula |
1.53 |
| Maytenus jamaicensis |
6.88 |
|
Malvaviscus arboreus |
2.70 |
|
Viburnum alpinum |
1.48 |
| Acalypha virgata |
6.79 |
|
Urbananthus critoniformis |
2.70 |
|
Conostegia montana |
1.24 |
| Hedyosmum arborescens |
6.60 |
|
Meriania purpurea |
2.64 |
|
Odontocline fadyenii |
1.19 |
| Palicourea alpina |
5.78 |
|
Cinnamomum montanum |
2.62 |
|
Haenianthus incrassatus |
1.11 |
| Smilax balbisiana |
5.30 |
|
Eugenia marchiana |
2.51 |
|
Ilex nitida |
1.05 |
| Clethra occidentalis |
5.12 |
|
Wallenia calyptrata |
2.50 |
|
Cestrum hirtum |
1.02 |
| Ocotea patens |
4.87 |
|
Picramnia antidesma |
2.33 |
|
Cionosicys pomiformis |
0.67 |
| Cassia viminea |
4.84 |
|
Miconia quadrangularis |
2.30 |
|
Bidens shrevei |
0.60 |
| Eugenia harrisii |
4.76 |
|
Myrsine acrantha |
2.23 |
|
Gonolobus jamaicensis |
0.60 |
| Prunus occidentalis |
4.66 |
|
Critonia parviflora |
2.22 |
|
Solanum punctulatum |
0.56 |
| Wallenia fawcettii |
4.58 |
|
Podocarpus urbanii |
2.22 |
|
Besleria lutea |
0.54 |
| Salmea scandens |
4.44 |
|
Sideroxylon montanum |
2.17 |
|
Cissampelos pareira |
0.51 |
| Wallenia crassifolia |
4.31 |
|
Xylosma nitida |
2.16 |
|
Blakea trinerva |
0.48 |
| Piper fadyenii |
4.11 |
|
Gordonia haematoxylum |
2.16 |
|
Lobelia assurgens |
0.45 |
| Sapium harrisii |
3.86 |
|
Schefflera sciadophyllum |
2.15 |
|
Vaccinium meridionale |
0.39 |
| Phenax hirtus |
3.75 |
|
Brunellia comocladiifolia |
1.99 |
|
Marcgravia brownei |
0.26 |
| Symplocos octopetala |
3.49 |
|
Miconia theaezans |
1.95 |
|
Garrya fadyenii |
0.25 |
| Calyptranthes rigida |
3.44 |
|
Callicarpa ferruginea |
1.92 |
|
Ilex vaccinoides |
0.18 |
| Vernonia pluvialis |
3.30 |
|
Cinchona officinalis |
1.90 |
|
Gonolobus stapelioides |
0.13 |
| Myrcianthes fragrans |
3.15 |
|
Rhamnus sphaerospermus |
1.90 |
|
Meriania leucantha |
0.11 |
|
|
|
|
|
|
Duranta erecta |
0.03 |
The maximum dominance of P.
undulatum as a seedling can be very great, 52 m m-2, 2.5
times the dominance of the highest native species, Alchornea latifolia.
A.
latifolia is a species whose germination and recruitment is greatly
enhanced by disturbance and after Hurricane Gilbert achieved dominance,
over large areas in the more disturbed areas, to a much greater degree
than any native species. Koanophyllon hardwarense is a climber that
forms clumps, one clump dominating a single sub-plot in SIFE, giving the
species such a high value. Eugenia virgultosa is the commonest understorey
species and can achieve dominance of the seedling layer except under the
densest shade. Mecranium purpurascens is a species that produces
suckers, and can achieve high local dominance by that means.
Dominance of trees as expressed
by basal area is less illuminating, as P. undulatum is present in
most plots only as a small tree, because of the early stage of the invasion.
In one plot P. undulatum comprised 68% of the total plot basal area,
though in most plots in heavily invaded forest, larger native trees, possibly
left when the original forest was cleared, dominate in terms of basal area.
4. Discussion
4.1
Relationship between the dominance of P. undulatum and native species
There is a clear,
approximately linear, negative relationship between the basal area of P.
undulatum and the density of the native seedling layer. A similar result
is obtained when the dominance of P. undulatum is expressed in relative
terms (i.e. as a proportion of plot basal area) and when dominance (absolute
or relative) is regressed against the dominance (summed heights) of native
seedlings. The density of native seedlings can be very low in primary forest
(though only one sub-plot in SIFE had no seedlings in it at all), but the
SIFE plots are large enough (21x15 m) for every plot to have some sub-plots
with the much higher seedling densities associated with disturbance, therefore
averaging-out plot means.
An interesting
question that we have not addressed in this study is where in the Blue
Mountains species diversity is highest. A preliminary inspection of the
data suggests it may not always be in primary forest, as sometimes old
secondary forest (little invaded by P. undulatum) can have a high
diversity. It is possible that the density and diversity of the understorey
in secondary forest would decline (perhaps in the short-term only) even
without P. undulatum, as the native shade-tolerant species that
are dominant in primary forest invade. Some of them (for example Guarea
glabra and Dendropanax arboreus) can have crowns that are about
as dense as those of P. undulatum trees (T. Goodland, unpublished
data). But we do not have sufficient data from old secondary forest, where
this re-invasion appears to be happening, to draw firm conclusions.
In the study
of the growth form of P. undulatum and native species (section 3.2.2)
a visual examination of the data shows that for some species (such as Eugenia
virgultosa, Guarea glabra) there seems to be a significant effect
of P. undulatum on leaf area, and for one species (E. virgultosa)
P.
undulatum appears to be affecting mean branch extension, though we
have not yet carried out any statistical analyses. There seems to be little
effect of P. undulatum adults on crown depth, so overall it is clear
that the small P. undulatum trees in the SIFE plots are not yet
having a major impact on native regeneration.
There does not
appear to be any relationship between the number of P. undulatum and
native trees (results not given here). This is probably because when the
forest started to regrow following clearance, P. undulatum was not
dominant as a species, but the scattered trees that did establish have
now lead to dense regeneration of the species, which now seems to be suppressing
the growth of smaller native plants.
All the correlations
presented here suffer from confounding, and this is particularly true when
interpreting the results for individual species. Several species occur
commonly as seedlings in primary forest but are rare or absent from secondary
forest. We cannot say whether this is due to the effects of P. undulatum
or the fact that adult trees of most of the species were eliminated when
the original forests were cut down, (21 (84%) of the HIFE plots are in
forest that is definitely secondary). The recruitment and growth of P.
undulatum has been markedly increased by the past human disturbance
in these forests. Also the disturbance created by Hurricane Gilbert has
complicated the results of HIFE as the density of advance regeneration
at the initial enumeration was probably significantly higher in some plots
than would have been the case without the hurricane. Another complication
is that all the HIFE plots are on the southern slopes of the Blue Mountains,
whilst four out of the 12 SIFE plots were either on the north slopes or
Grand Ridge, areas which tend to have a different forest composition, perhaps
because of higher rainfall.
Ideally an experimental
approach is needed if the objective is to find out what is limiting the
re-invasion of these secondary forests by primary forest species, planting
seedlings of those common primary forest species absent or rare in secondary
forest, beneath dense stands of P. undulatum and beneath stands
of native trees in univaded secondary forest. The majority of native species
in the Blue Mountains either require disturbance for their recruitment
or benefit from it. Of the 27 most studied species the recruitment of 22
was increased by disturbance (Sugden et al. 1988, Healey 1990, Vernon
1991, Dalling 1992). Therefore the effect of P. undulatum on recruitment
following disturbance is probably crucial to a majority of species.
4.2 Competitive
success of P. undulatum
4.2.1
Performance of individuals
Many analyses of the growth of
species in our permanent sample plots (including several not presented
here) show that P. undulatum is one of the fastest growing species
in a wide range of degrees of disturbance, from its seedling stage through
to the tree stage. Our analysis of the above-ground growth form of large
seedlings shows that P. undulatum, compared with the 17 native species,
has:
-
a high mean branch extension,
therefore low height:crown diameter ratio and high crown area
-
an exploratative branching pattern,
able to exploit higher light levels arriving from a particular direction
-
a consistently deep crown
-
a high leaf area per individual
It will be possible with further
enumerations of SIFE to accurately age these seedlings, so allowing an
examination of how these parameters vary with age, not just size. Our information
on the growth form and architecture of trees of these species is much less
complete. The native species with the closest growth form to P. undulatum
is Hedyosmum arborescens, (though P. undulatum had a greater
mean branch extension and crown depth and significantly larger leaf
area), and interestingly H. arborescens had a closer similarity
in the RBAI of its trees to P. undulatum than any other native species.
Overall there was no close comparison between P. undulatum and native
species.
One way in which species may
differ in their response to a low light environment is their ability to
position their whole axis towards higher light levels. In very low light
levels (usually beneath dense stands of P. undulatum trees) P.
undulatum seedlings are often leaning or prostrate. This is probably
a sign of stress (indeed where this occurs in the most heavily invaded
HIFE plots a number of these seedlings have died-back, and even died) but
they do tend to be oriented towards higher light levels. This is occasionally
seen in native species, though not so often (T. Goodland, pers. obs.).
We have some intriguing evidence
that the below-ground competitive ability of P. undulatum is very
high, but further research would be needed to provide a clearer picture.
The evidence that we do have comes from measurements of the root system
of six seedlings of P. undulatum and eight native species (Goodland
& Healey, unpublished data). In summary, the root system of P. undulatum
was comparatively extensive, usually shallow, and with individual roots
sometimes longer than the height of the stem. In Australia the root system
of P. undulatum seedlings was highly variable, depending on soil
type (Gleadow & Ashton 1981).
4.2.2
Populations
The high population density that
P.
undulatum can reach is one of the most striking aspects of the invasion
when seen in the forest, a characteristic of invasive plants (Huenneke
& Vitousek 1990). The high seed production of P. undulatum (Goodland
& Healey 1996) is clearly important, but we have no information on
the seed production of native species.
In HIFE following the removal
of all existing P. undulatum the recruitment of P. undulatum
could
be very high. In plot 20 at t0 (before treatment, but after
the effects of Hurricane Gilbert) the density of P. undulatum seedlings
had been 105.6 m-2 whilst the density of P. undulatum
recruits
was 155.3 m-2 at t1 and 161.9 m-2 at t2,
a combined recruitment density of 317.2 m-2. The t1 P. undulatum
recruitment density of 155.3 m-2 compares with a total recruitment
of native species of only 6.9 seedlings m-2 in that plot. We
do not have data from HIFE or SIFE on seedling recruitment in primary forest
so cannot make a quantitative comparison between secondary and primary
forest, but the density of recruitment of some species (for example Eugenia
virgultosa, Guarea glabra and Prunus occidentalis) can
be high (>50 seedlings m-2) in primary forest (T. Goodland,
personal observations).
The survivorship of P.
undulatum is also surprisingly high for a species whose recruitment
is so affected by degree of disturbance, although mortality of small seedlings
can be very high. For example, in one sub-plot in HIFE that had experienced
quite severe disturbance by Hurricane Gilbert, then heavy shading by P.
undulatum saplings, of 115 P. undulatum seedlings 20 cm high
in 1991, 109 had died by 1995, a mortality of 94%.
4.3
Persistence of P. undulatum
The persistence
of P. undulatum (or any species, introduced or native), in the Blue
Mountains can be considered in three different categories:
-
The longevity of
individual trees; in the case of P. undulatum or any invasive species,
the longevity of the "founding" individuals.
-
The rate of recruitment
of new individuals
-
Changes in the
physical environment, and biotic relations of the species
These are shown
in Figure 15, and discussed in greater detail below.
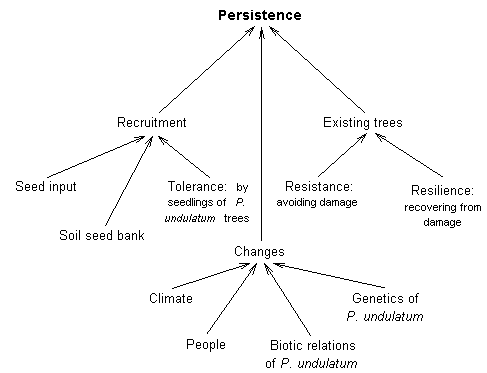
Figure
15. Factors determining the persistence of P.
undulatum
4.3.1
Longevity of individuals
It is difficult to say how old
the largest P. undulatum trees close to Cinchona are, as the species
does not have distinct growth rings (Meir 1991). We have found a few (less
than 10) dying trees in the lower Clydesdale valley (within a kilometre
of Cinchona), presumably "dying back" either as a result of senescence,
disease or adverse environmental conditions. But there are other trees
nearby of a similar size that seem perfectly healthy, so P. undulatum
is not a short-lived species. These trees are about 20 m tall but in Australia
P.
undulatum can reach 30 m, indicating a much greater age for the Australian
trees.
As the invasion progresses,
the reaction of P. undulatum trees to future hurricanes will become
more important. Useful data is now available on the effects of H. Gilbert
on P. undulatum and native trees in mostly primary forest (Bellingham
1993). The effect of H. Gilbert was assessed in 91 plots totalling 1.10
ha between February 1989 and August 1990, i.e. 5-23 months after the hurricane;
namely the E.V.J. Tanner (Tanner 1977); J.R. Healey plots (Healey 1990);
26 non-bounded plots along a transect in the Mabess River valley and the
16 systematically placed plots of P.J. Bellingham (Bellingham 1993). A
total of 5242 native and 53 P. undulatum trees were sampled.
Data on the 47 commonest species
were analysed. P. undulatum was one of nine species that had no
stems killed by the hurricane. P. undulatum was also one of only
five species which had no stems that were completely defoliated and no
stems broken. However 11.4% of P. undulatum were uprooted (the ninth
highest species percentage, the mean for all species was 0.49%). Bellingham
(1993) classified all the species into five categories of resistance to
the hurricane according to levels of non-fatal damage and mortality. P.
undulatum was placed into the most resistant category, though the relatively
small number of stems (53) makes the classification tentative. In contrast
to all the other species in the resistant category, P. undulatum
is readily recruited into hurricane caused gaps. Because of this, Bellingham
(1993) considered the species to have no ecological analogue in the native
tree flora.
P. undulatum should
also be considered a resilient species, in the sense that if damaged (for
example, blown down or snapped) it shows a great ability to survive. Trees
that have been blown down often put up many vertical ("epitrophic") sprouts
along the fallen trunk. These sprouts can become very large (>25 cm DBH)
and would indicate a prolonged life perhaps similar to that of the long-lived
native tree Cyrilla racemiflora. Cut stems of P. undulatum
produced a much greater biomass of resprouts than all native species except
Ilex
macfadyenii. After 27 months P. undulatum produced about ten
times the mean biomass of all native species combined (Healey et al.).
4.3.2
Recruitment of new individuals
The ability of a species to build
up a soil seed bank can be an important means of persisting in an area,
so we investigated the soil seed bank of P. undulatum and native
species in the Remove P. undulatum Trees and Undisturbed Control
treatments in HIFE in 1993. The maximum mean P. undulatum soil seed
bank density for any plot (based on the number of emergents from 10 soil
samples) was 17,540 seeds m-2, (with a maximum of 65,000 seeds
m-2 for a single sample), 8.6 times as dense as the next densest
species (Clethra occidentalis). It is unusual for a species commonly
with a "seedling bank" (i.e. seedlings existing beneath the canopy) to
build up such a large soil seed bank. In this respect P. undulatum is
quite unlike any native species in the Blue Mountains.
P. undulatum is rather
poor at recruiting beneath dense canopies of P. undulatum trees.
But, given the high seed production and soil seed bank, and the requirement
for only slight disturbance for germination and recruitment, there usually
are some P. undulatum seedlings of a range of size classes beneath
all but the densest P. undulatum stands. It is likely that these
have been recruited after sporadic, usually hurricane-caused, disturbance
events.
There are native species able
to grow in less disturbed conditions that P. undulatum, species
that may have a higher chance of growing up beneath mature P. undulatum
trees than P. undulatum itself. As the crowns of large P. undulatum
trees rise above ground level, the light levels on the forest floor seems
to increase (and the crown itself sometimes appears to thin). It is possible
that light levels would be significantly raised beneath a stand of uniformly
large and tall P. undulatum, but we know of no such stands at present,
large P. undulatum trees are still scattered either in otherwise
lightly invaded forest or amongst smaller P. undulatum regeneration.
From what we know it seems highly unlikely that any native shade-tolerant
species could start to replace P. undulatum, though the most shade-tolerant
species such as Eugenia virgultosa or Guarea glabra may be
able to survive in a Blue Mountains completely invaded by P. undulatum.
4.3.3
Changes in the biological and physical environment of the Blue Mountains
Global climate change is likely
to lead to an increase in the strength of hurricanes. This would more likely
favour P. undulatum than most native species, though it is clearly
possible that some gap-demanding native species would also benefit. There
is the possibility that non-tree plants may become much more dominant constituents
of the forest, especially introduced species such as Polygonum chinense,
Hedychium
gardneranum or Shuteria vestita. If the Blue Mountains were
to become drier, and suffer longer periods of very low rainfall (continuing
a trend that many local people say has been evident for the last several
years), fire could start to affect forest undisturbed by humans in a much
more serious way, excluding trees altogether and favouring introduced grasses
such as Melinis minutiflora.
The future biotic relations
of P. undulatum could be very important, and are very unpredictable.
For example in the British Isles sycamore (Acer pseudoplatanus)
is a common invader of ash woodlands but once it has achieved dominance
it fails to regenerate beneath its own canopy, whilst ash does (P. Savill,
pers. comm., 1994). A possible explanation for this is that the litter
layer builds up beneath a sycamore canopy providing shelter for slugs from
frost during the winter; sycamore seedlings are vulnerable to slug damage
whilst ash seedlings are not (P. Binggeli, pers. comm.). It is this type
of unexpected interaction with native organisms that could provide an effective
limit on the density, if not distribution, of P. undulatum. P.
undulatum does suffer some herbivory in the Blue Mountains. So far
we have identified seven different patterns of damage that we suspect are
caused by seven distinct agents (Goodland & Healey 1996). Three of
the types of damage were very localised (several square metres) in which
all P. undulatum individuals were damaged, suggesting the possibility
of future spread. All the responsible pest and pathogen species are most
likely to be local "generalist" species and none have lead to such extensive
defoliation that death seems likely. It is much too early to say what the
ultimate population density of P. undulatum might be, when in equilibrium
with native plants, pests and pathogens.
Weedy species usually have
a depauperate genetic structure (Burdon & Marshall 1981) and this can
be particularly pronounced when introduced to a new location in small numbers
because of a "bottleneck effect" (Harper 1977). We think that P. undulatum
was introduced to Jamaica in very small numbers, so presumably the population
is likely to have a narrow genetic range. We do not know to what extent
P.
undulatum will change genetically now that it has been introduced to
the Blue Mountains.
Acknowledgements
This publication
is an output from a research project partly funded by the United Kingdom
Department for International Development (DFID) for the benefit of developing
countries. The views expressed are not necessarily those of DFID.
R4742 Forestry Research Programme. The work was co-funded by the
Darwin Initiative of the United Kingdom Department of Environment, Transport
and the Regions.
References
Adams, C.D.
1972. Flowering plants of Jamaica. University of West Indies, Mona,
Jamaica.
Bellingham,
P.J. 1993. The effects of a hurricane on Jamaican montane rain forests.
PhD dissertation, University of Cambridge, U.K.
Bellingham,
P.J., Tanner, E.V.J. & Healey, J.R. 1995. Damage and responsiveness
of Jamaican montane forest tree species after disturbance by a hurricane.
Ecology,
76(8),
2562-80.
Bengry, R. &
Serrant, S. 1949. Trip to Newhaven Gap. Natural History Notes, 3,
189-194.
Burdon, J.J.
& Marshall, D.R. 1981. Biological control and the reproductive mode
of weeds. Journal of Applied Ecology, 18, 649-58.
Dalling, J.D.
1992. The regeneration on landslides in the Blue Mountains, Jamaica.
PhD
dissertation, University of Cambridge, Cambridge, UK.
Gleadow, R.M.
& Ashton, D.H. 1981. Invasion by Pittosporum undulatum of the
forests of central Victoria. I: Invasion patterns and plant morphology.
Australian
Journal of Botany, 29, 705-20.
Goodland, T.
1990. The spread of an invasive tree species, Pittosporum undulatum,
into the forests of the Blue Mountains of Jamaica. BSc dissertation,
University of Wales, Bangor, UK.
Goodland, T.
& Healey, J.R. 1996. The invasion of Jamaican montane rainforests
by the Australian tree Pittosporum undulatum. University of Wales,
Bangor.
Grime, J.P.
1979. Plant strategies and vegetation processes. John Wiley &
Sons, Chichester.
Grubb, P.J.
& Tanner, E.V.J. 1976. The montane forests and soils of Jamaica. J.
of the Arnold Arboreum, 57, 313-68.
Harper, J.L.
1977. The population biology of plants. Academic press, London,
UK.
Healey, J.R.
1990. Regeneration in a Jamaican montane tropical rainforest. PhD
dissertation, University of Cambridge.
Healey, J.R.,
Goodland, T.C.R. & Hall, J.B. 1992. The impact on forest biodiversity
of an invasive tree species and the development of methods for its control.
First annual report of ODA Forestry Research Project R4742, School of Agricultural
and Forest Sciences, University of Wales, Bangor, U.K.
Healey, J.R.,
Goodland, T.C.R. & Hall, J.B. 1995. The impact on forest biodiversity
of an invasive tree species and the development of methods for its control.
Final report of ODA Forestry Research Project R4742, School of Agricultural
and Forest Sciences, University of Wales, Bangor, U.K.
Huenneke, L.F.
& Vitousek, P.M. 1990. Seedling and clonal recruitment of the invasive
tree Psidium cattlenianum: implications for management of native
Hawaiian forests. Biological Conservation, 53, 199-211.
Hughes, C.E.
& Styles, B.T. 1987. The benefits and potential risks of woody legume
introductions. The International Tree Crops Journal, 4, 209-48.
Meir, P. 1991.
A
pilot study of tree-ring formation in a Jamaican montane rainforest.
SAFS, University of Wales, Bangor.
Mitchell, T.
1989. A study of the influence of an introduced plant species. Pittosporum
undulatum, on the faunal and floral diversity, structure and composition
in the mountains of Jamaica. BSc thesis, University of Cambridge.
Muchoney, D.M.,
Iremonger, S. & Wright, R. 1994. Blue and John Crow Mountains National
Park, a Rapid Ecological Assessment. The Nature Conservancy, Arlington,
Virginia, USA.
Newton, A.C.
& Healey, J.R. 1989. Establisment of Clethra occidentalis on
stems of the tree-fern Cyathea pubescens in a Jamaican montane rain
forest. Journal of Tropical Ecology, 5, 441-45.
Richardson,
D.M. & Brink, M.P. 1985. Notes on Pittosporum undulatum in the
south-western cape. Veld & Flora, 71, 75-7.
Sheil, D., Burslem,
D.F.R.P. & Alder, D. 1995. The interpretation and misinterpretation
of mortality rate measures. Journal of Ecology, 83, 331-333.
Sokal, R.R.
& Rohlf, F.J. 1981. Biometry. W.H. Freeman & Co., New York.
Sugden, A.M.,
Tanner, E.V.J., & Kapos, V. 1985. Regeneration following clearing in
a Jamaican montane forest: results of a ten-year study. Journal of Tropical
Ecology, 1, 329-51.
Vernon, P. 1991.
Predicatability
of seedling dynamics in a Jamaican montane rain forest.
MSc dissertation,
University of Wales, Bangor, UK.
Appendix.
Woody plant species occurring in permanent sample plots in the western
Blue Mountains.
Status: BME
- Endemic to the BMts; JE - Jamaican endemic; N - Native to Jamaica; I
- Introduced.
| Code |
Full species name |
Family |
Local name |
Status |
| Aca vir |
Acalypha virgata L. |
Euphorbiaceae |
|
JE |
| Alc lat |
Alchornea latifolia Sw. |
Euphorbiaceae |
Womanwood |
N |
| Bes lut |
Besleria lutea L. |
Gesneriaceae |
|
N |
| Bid shr |
Bidens shrevei Britton |
Asteraceae |
|
JE |
| Bla tri |
Blakea trinerva L. |
Melastomataceae |
|
N |
| Boc fru |
Bocconia frutescens L. |
Papaveraceae |
John Crow bush |
N |
| Boe cau |
Boehmeria caudata Sw. |
Urticaceae |
|
N |
| Bru com |
Brunellia comocladiifolia Humb. &
Bonpl. |
Brunelliaceae |
Sumach |
N |
| Bru jam |
Brunfelsia jamaicensis (Benth.) Griseb. |
Solanaceae |
|
BME |
| Cal fer |
Callicarpa ferruginea Sw. |
Verbenaceae |
|
N |
| Cal rig |
Calyptranthes rigida Sw. |
Myrtaceae |
|
N |
| Cas vim |
Cassia viminea L. |
Caesalpiniaceae |
Treeribs; fourvine |
JE |
| Ces hir |
Cestrum hirtum Sw. |
Solanaceae |
|
N |
| Cha glo |
Chaetocarpus globosus (Sw.) Fawcett
& Rendle |
Euphorbiaceae |
|
N |
| Cin mon |
Cinnamomum montanum (Sw.) Bercht.&
Presl. |
Lauraceae |
Wild cinnamon |
N |
| Cin off |
Cinchona officinalis L. |
Rubiaceae |
|
I |
| Cin pub |
Cinchona pubescens Vahl. |
Rubiaceae |
|
I |
| Cio pom |
Cionosicys pomiformis Griseb. |
Cucurbitaceae |
Duppy apple |
JE |
| Cis par |
Cissampelos pareira L. |
Menispermaceae |
|
N |
| Cit cau |
Citharexylum caudatum L. |
Verbenaceae |
Fiddlewood |
N |
| Cle ale |
Clethra alexandra Griseb. |
Clethraceae |
|
BME |
| Cle occ |
Clethra occidentalis (L.) Kuntze |
Clethraceae |
Soapwood |
N |
| Cle the |
Cleyera theaoides (Sw.) Choisy |
Theaceae |
|
N |
| Cli ter |
Clibadium terebinthinaceum (Sw.) DC. |
Asteraceae |
|
N |
| Clu hav |
Clusia havetiodes (Griseb.) Planch.
& Triana |
Guttiferae |
Fan fan; wild mango |
JE |
| Con mon |
Conostegia montana (Sw.) DC. |
Melastomataceae |
|
BME |
| Cri par |
Critonia parviflora DC. |
Asteraceae |
|
JE |
| Cya con |
Cyathea concinna (Baker ex Jenman)
Jenman |
Cyatheaceae |
|
BME |
| Cya fur |
Cyathea furfuracea Baker |
Cyatheaceae |
|
N |
| Cya pub |
Cyathea pubescens Mettenius ex Kuhn |
Cyatheaceae |
|
BME |
| Cya woo |
Cyathea woodwardioides Kaulf. |
Cyatheaceae |
|
N |
| Cyr rac |
Cyrilla racemiflora L. |
Cyrillaceae |
Beetwood |
N |
| Dap ame |
Daphnopsis americana (Mill.) J.R.Johnston |
Thymelaeaceae |
|
N |
| Den arb |
Dendropanax arboreus (L.) Decne &
Planch. |
Araliaceae |
Manjack |
N |
| Den nut |
Dendropanax nutans (Sw.) Decne &
Planch. |
Araliaceae |
Manjack |
BME |
| Den p/n |
Dendropanax pen/nut |
Araliaceae |
|
|
| Den pen |
Dendropanax pendulus (Sw.) Decne &
Planch. |
Araliaceae |
Manjack |
JE |
| Dur ere |
Duranta erecta L. |
Verbenaceae |
|
N |
| Eug alp |
Eugenia alpina (Sw.) Willd. |
Myrtaceae |
|
BME |
| Eug bra |
Eugenia brachythrix Urban |
Myrtaceae |
|
BME |
| Eug har |
Eugenia harrisii Krug & Urban |
Myrtaceae |
Rodwood |
JE |
| Eug mar |
Eugenia marchiana Griseb. |
Myrtaceae |
|
JE |
| Eug mon |
Eugenia monticola (Sw.) DC |
Myrtaceae |
Rodwood |
N |
| Eug vir |
Eugenia virgultosa (Sw.) DC |
Myrtaceae |
Rodwood |
JE |
| Gar fad |
Garrya fadyenii Hook. |
Garryaceae |
|
N |
| Ges alp |
Gesneria alpina (Urb.) Urb |
Gesneriaceae |
|
BME |
| Gon jam |
Gonolobus jamaicensis Rendle |
Asclepiadaceae |
|
BME |
| Gon sta |
Gonolobus stapelioides Desv. |
Asclepiadaceae |
|
JE |
| Gor hae |
Gordonia haematoxylum Swartz |
Theaceae |
Bloodwood |
JE |
| Gua gla |
Guarea glabra Vahl |
Meliaceae |
Broadleaf: alligator wood |
JE |
| Hae inc |
Haenianthus incrassatus (Sw.) Griseb |
Oleaceae |
|
BME |
| Hed arb |
Hedyosmum arborescens Sw. |
Chloranthaceae |
Headache bush |
N |
| Hed nut |
Hedyosmum nutans Sw. |
Chloranthaceae |
Headache bush |
N |
| Het umb |
Heterotrichum umbellatum (Mill) Urb. |
Melastomataceae |
|
N |
| Ile har |
Ilex harrisii Loes. |
Aquilfoliaceae |
|
JE |
| Ile mac |
Ilex macfadyenii (Walp.) Rehder |
Aquilfoliaceae |
Black tea |
N |
| Ile nit |
Ilex nitida (Vahl) Maxim |
Aquilfoliaceae |
|
N |
| Ile obc |
Ilex obcordata Sw. |
Aquilfoliaceae |
|
BME |
| Ile sid |
Ilex sideroxyloides (Sw.) Griseb. |
Aquilfoliaceae |
|
N |
| Ile vac |
Ilex vaccinoides Loes. |
Aquilfoliaceae |
|
BME |
| Jun luc |
Juniperus lucayana Britton |
Cuppressaceae |
Juniper |
N |
| Koa har |
Koanophyllon hardwarense (Proctor
ex C.Adams) R.King & H.Robinson |
Asteraceae |
|
BME |
| Lob ass |
Lobelia assurgens L. |
Campanulaceae |
Fat & borrow; milkbush |
N |
| Lob mar |
Lobelia martagon (Griseb.) Hitchc. |
Campanulaceae |
|
BME |
| Lyo jam |
Lyonia jamaicensis (Sw.) D.Don |
Ericaceae |
|
N |
| Lyo oct |
Lyonia octandra (Sw.) Griseb. |
Ericaceae |
|
JE |
| Mal arb |
Malvaviscus arboreus Cav. |
Malvaceae |
|
N |
| Man lyg |
Mannetia lygistum (L.) Sw. |
Rubiaceae |
|
BME |
| Mar bro |
Marcgravia brownei (Triana & Planch.)
Krug & Urban |
Marcgraviaceae |
|
JE |
| May jam |
Maytenus jamaicensis Krug & Urban |
Celastraceae |
Sweetwood |
N |
| Mec pur |
Mecranium purpurascens (Sw.) Triana |
Melastomataceae |
|
JE |
| Mel Bl1 |
Unidentified Melastome species in
block 1 of HIFE |
Melastomataceae |
|
|
| Mer leu |
Meriania leucantha (Sw.) Sw. |
Melastomataceae |
|
JE |
| Mer pur |
Meriania purpurea (Sw.) Sw. |
Melastomataceae |
|
N |
| Met atr |
Metastelma atrorubens Schltr. |
Asclepiadaceae |
|
N |
| Met har |
Metastelma harrisii Schltr. |
Asclepiadaceae |
|
BME |
| Mic dod |
Miconia dodecandra (Desr.) Cogn. |
Melastomataceae |
|
N |
| Mic qua |
Miconia quadrangularis (Sw.) Naud. |
Melastomataceae |
|
N |
| Mic rig |
Miconia rigida (Sw.) Triana |
Melastomataceae |
|
N |
| Mic the |
Miconia theaezans (Bonpl.) Cogn. |
Melastomataceae |
|
N |
| Mik max |
Mikania maxonii Proctor |
Asteraceae |
|
BME |
| Myr acr |
Myrsine acrantha Krug & Urban |
Myrsinaceae |
|
N |
| Myr cer |
Myrica cerifera L. |
Myricaceae |
Waxwood |
N |
| Myr cor |
Myrsine coriacea (Sw.) R.Br. ex Roem.&
Schult. |
Myrsinaceae |
|
N |
| Myr fra |
Myrcianthes fragrans (Sw.) McVaugh |
Myrtaceae |
|
N |
| Oco pat |
Ocotea patens (Sw.) Nees |
Lauraceae |
Sweetwood |
N |
| Odo fad |
Odontocline fadyenii (Griseb.) B.Nord. |
Asteraceae |
|
JE |
| Oss asp |
Ossaea asperifolia (Naud.) Triana |
Melastomataceae |
|
N |
| Pal alp |
Palicourea alpina (Sw.) DC. |
Rubiaceae |
|
N |
| Pas pen |
Passiflora penduliflora Bert. ex DC. |
Passifloraceae |
|
N |
| Per alp |
Persea alpigena (Sw.) Spreng. |
Lauraceae |
Wild Pear |
JE |
| Phe hir |
Phenax hirtus (Sw.) Wedd. |
Urticaceae |
|
N |
| Phy arb |
Phyllanthus arbuscula (Sw.) J.F. Gmelin |
Euphorbiaceae |
|
N |
| Pic ant |
Picramnia antidesma Sw. |
Simaroubaceae |
|
N |
| Pip arb |
Piper arboreum Aublet |
Piperaceae |
|
N |
| Pip fad |
Piper fadyenii C.DC. |
Piperaceae |
|
JE |
| Pit und |
Pittosporum undulatum Vent. |
Pittosporaceae |
Wild coffee; mock orange |
I |
| Pit vir |
Pittosporum viridiflorum Sims vel.aff. |
Pittosporaceae |
Wild coffee; mock orange |
I |
| Pod urb |
Podocarpus urbanii Pilger |
Podocarpaceae |
Fineleaf; yucca |
N |
| Pru occ |
Prunus occidentalis Sw. |
Rosaceae |
|
N |
| Psy cor |
Psychotria corymbosa Sw. |
Rubiaceae |
|
JE |
| Psy slo |
Psychotria sloanei Urban |
Rubiaceae |
|
BME |
| Rha sph |
Rhamnus sphaerospermus Sw. |
Rhamnaceae |
Buckthorn |
N |
| Sal sca |
Salmea scandens (L.) DC. |
Asteraceae |
|
N |
| Sap har |
Sapium harrisii Urban ex Pax |
Euphorbiaceae |
Milkwood |
JE |
| Sch inv |
Schradera involucrata (Sw.) K.Schum. |
Rubiaceae |
|
JE |
| Sch sci |
Schefflera sciadophyllum (Sw.) Harms |
Araliaceae |
Old name=woman wood |
JE |
| Sid mon |
Sideroxylon montanum (Swartz) Pennington |
Sapotaceae |
Bulletwood |
JE |
| Smi bal |
Smilax balbisiana Kunth |
Smilacaceae |
Chainy root |
N |
| Smi dom |
Smilax domingensis Willd. |
Smilacaceae |
|
N |
| Sol pun |
Solanum punctulatum Dunal |
Solanaceae |
|
BME |
| Sym oct |
Symplocos octopetala Sw. |
Symplocaceae |
|
JE |
| Tou gla |
Tournefortia glabra L. |
Boraginaceae |
|
N |
| Tre flo |
Trema floridanum Britton |
Ulmaceae |
|
N |
| Tur occ |
Turpinia occidentalis (Sw.) G.Don |
Staphyleaceae |
Candlewood |
N |
| Urb cri |
Urbananthus critoniformis (Urban)
R.King |
Asteraceae |
|
BME |
| Ure ela |
Urera elata (Sw.) Griseb. |
Urticaceae |
|
JE |
| Vac mer |
Vaccinium meridionale Sw. |
Ericaceae |
Bilberry |
N |
| Ver plu |
Vernonia pluvialis Gleason |
Asteraceae |
|
BME |
| Vib alp |
Viburnum alpinum Macf. ex Britton |
Caprifoliaceae |
Blackwattle |
N |
| Vib vil |
Viburnum villosum Sw. |
Caprifoliaceae |
|
N |
| Wal cal |
Wallenia calyptrata Urban |
Myrsinaceae |
|
BME |
| Wal cra |
Wallenia crassifolia Mez |
Myrsinaceae |
|
BME |
| Wal faw |
Wallenia fawcettii Mez |
Myrsinaceae |
|
BME |
| Wei pin |
Weinmannia pinnata L. |
Cunoniaceae |
|
N |
| Xyl nit |
Xylosma nitida (Hellenius) I.Gray
ex Griseb. |
Flacourtiaceae |
|
JE |